In reality, I know nothing about creating drugs. But I assume that I do. I imagine that people with white lab coats and thick rimmed black glasses walk around the lab all day holding beakers, most of which are spewing smoke. They mix this and that together to create a new mosaic drug. Then they put it in a 12 inch long needle and try it out on their subjects, people who signed up to get paid $30/day as human guinea pigs. That's innovation!

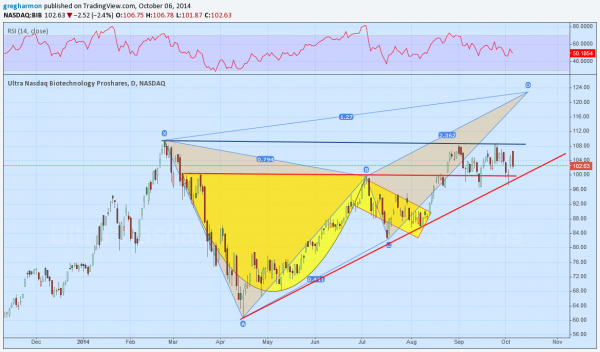
This thinking inspired me to look at the chart of the Ultra NASDAQ Biotechnology ETF (NASDAQ:BIB), above. The chart is a mixture of different technicals.
There are 3 types of technical analysis shown, each derived from a different history. But each signals that the path may be easier to the upside for Biotechs. First, the yellow Cup and Handle pattern, triggered with a move back over the top of the Cup. This pattern carries a target to 136.
Second, the two red lines show an Ascending Triangle. The break above the horizontal one created a target to 136 as well.
Next, the 2 red shaded triangles show a Butterfly harmonic pattern. This has a Potential Reversal Zone at about 124. The price has stalled over the past month, holding over the round number 100 and the breakout levels from the Cup and Handle and Ascending Triangle, but below the prior high at 108. A move over that may lead to continuation higher. All bets are off under the stop though around 99.
Disclosure: The information in this blog post represents my own opinions and does not contain a recommendation for any particular security or investment. I or my affiliates may hold positions or other interests in securities mentioned in the Blog, please see my Disclaimer page for my full disclaimer.
