The FDA issued an accelerated approval status for Biogen (NASDAQ:BIIB)'s new Alzheimer drug with specific requirements related to consumer use and results. In these cases, the FDA is allowing Biogen to move into a more open consumer trial where the results and side-effects of this new drug will be identified fairly quickly.
This new drug targets the plague in the heart and brain that is associated with Alzheimer's. Over 5 million Americans live with some form of Alzheimer's currently. The Alzheimer’s Association continues to provide detailed statistics related to how this disease relates to various segments of American society. You can read more about how big this announcement is in terms of how Alzheimer's affects Americans in this 2019 Alzheimer's Disease Facts And Figures report.
This news of a new Biogen Alzheimer's drug has sent XBI skyrocketing. Yet, the news may not be enough to continue to trend across an entire market sector. The one thing that I would like to point out is that news of a single drug that has entered early-stage accelerated approval by the FDA does not make a new trend. It makes a news blip.
Either way, the long-term results related to the potential success of this new drug may prompt a rally in Biogen and the Biotech sector over the next few months and years. Alzheimer's is a big problem for many nations across the globe, so the potential for this new solution, if priced well, may be huge for Biogen.
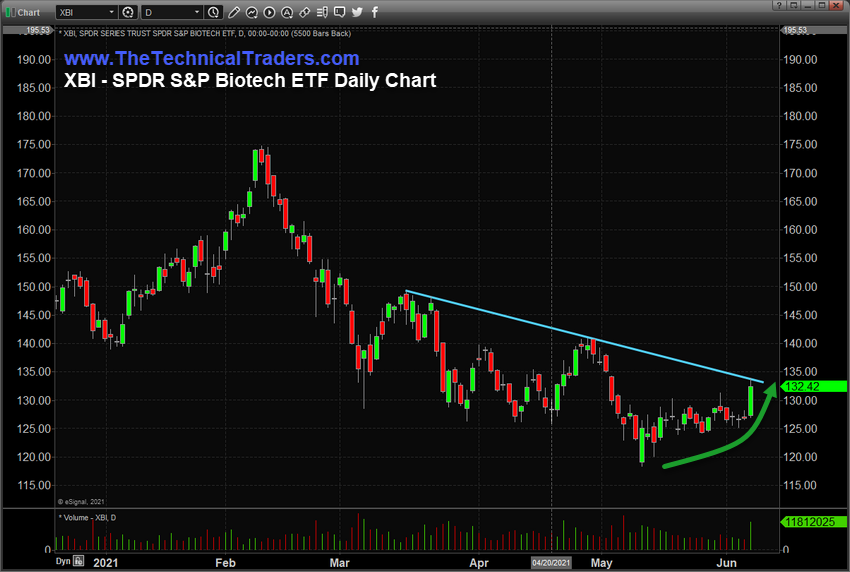
The daily XBI chart below shows a clear downward price channel (CYAN line) that is acting as resistance. XBI must rally above this level in order to prompt any bigger upside price trend. As of right now, XBI has rallied up to that level but has stalled near that resistance. It is likely that the news prompted a big upside trend, however, the reality is that we won't know how successful this new drug is for Biogen for many months/years. So, the real opportunity could be a ways away still.

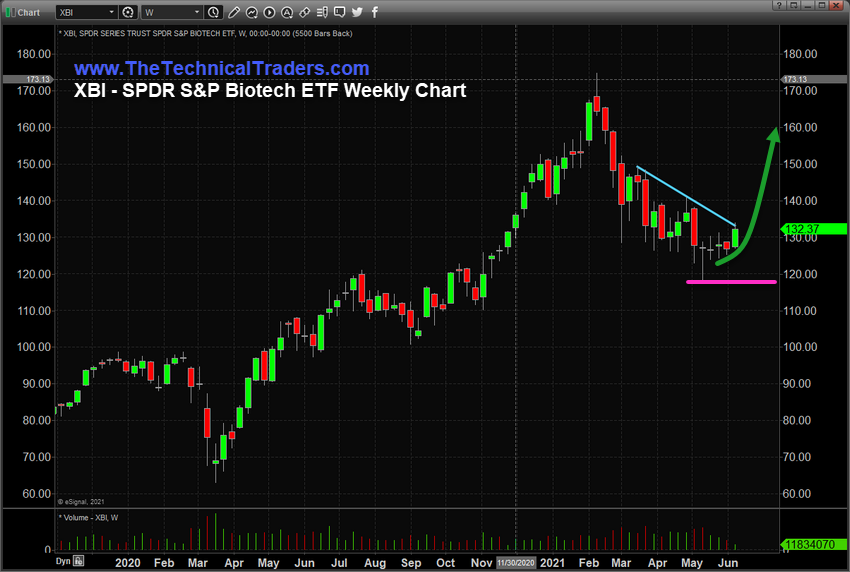
The weekly XBI chart below highlights recent support near 118.40 (the MAGENTA line) and continues to show the downward sloping resistance channel (the CYAN line). We believe XBI will have to break out of these price boundaries before it starts any new trends. Currently, the upside price rally is testing the upper resistance levels. If it breaks above that level quickly, we may see some bigger upside trending. If not, it will likely fall back into the range of these boundaries while attempting to find support again.

What does our proprietary BAN strategy say about this new XBI trigger? Currently, XBI is reporting as bearish and is in a risk-off trend mode. XBI is also trending/ranking near the bottom of our BAN ETF sector list – meaning that XBI is showing very limited upward trend strength at the moment. This recent news may change that over the next few weeks. Due to these factors, XBI is not something that BAN would be trading at the moment.
