The Biotech sector ended a long run higher in July of 2015. From that peak, the Biotech Index lost over 40% the next 7 months. Since that February low, though, the sector has languished. It has attempted to rise a couple of times only to fail and fall back. Several things in the chart of the Biotech ETF (NASDAQ:IBB) suggest that this pattern may be coming to an end.
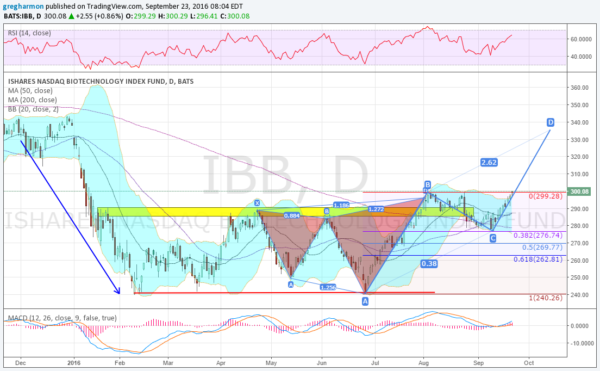
The chart below shows the last leg down and the aftermath of the fall from the highs. A broad-based consolidation from February through August led to a failed break out. But on closer review, the failure may be the start of a reversal out of consolidation and to the upside.

Since making a high in April, the price action has traced out a bearish Shark harmonic pattern. That reached its Potential Reversal Zone (PRZ) in August and prompted the pullback. Two weeks ago the Index retraced 38.2% of the pattern, reaching its target. Since then it has been all upward price action. This pullback was also a retest of the 200-day SMA, which held as support. Coming into Friday, the Biotech Index is at the August high, and has bullish momentum behind it.
A break to the upside to a new higher high would give a target on an AB=CD pattern to 335. in addition to the bullish momentum from a rising RSI and MACD, the Bollinger Bands® are opening to the upside. And the chart shows a Golden Cross, with the 50-day SMA crossing up through the 200-day SMA. Everything is lining upi for a bullish run higher in Biotechs.
