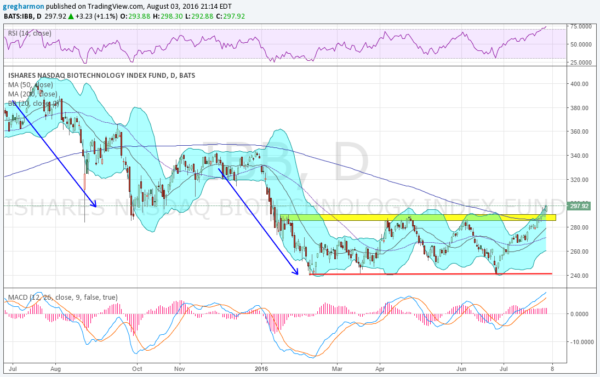
Biotech stocks have had a rough year. Since the July peak in 2015 the iShares Nasdaq Biotechnology RYG (NASDAQ:IBB) lost about 60% of its value at the bottom. The first 6 months may have been easier for traders to deal with. The trend was clearly down then. But since bouncing in February, the ETF has moved sideways in a channel. It tested the top of the channel in April and fell back. It tested it again in June and failed. Then it tested the channel top again to start this week and has pushed through. Will this third take hold or will it pullback, a failed break out?
The chart below has some indications supporting the run higher continuing. The RSI is bullish and rising. The MACD is also rising. The Bollinger Bands® have turned higher. And the price has moved over the 200 day SMA for the first time since September. The 20 and 50 day SMA’s are turned higher following the price.

The only kink in the chart is that the momentum indicators are running hot. They can always get hotter. But the RSI is now technically overbought, over 70. The MACD is also at the peak it saw in July 2015. Often when a break out happens and it gets overbought the price comes back to retest the breakout. Many would probably welcome that pullback and retest and they have not bought it just yet. That might be another check mark in the column for a continued price move higher. For now, Biotech Breakout: Take 3 is underway.
Disclosure: The information in this blog post represents my own opinions and does not contain a recommendation for any particular security or investment. I or my affiliates may hold positions or other interests in securities mentioned in the Blog, please see my Disclaimer page for my full disclaimer.
