When you know how to read market action with the Opening Range you can see when and how another market is influencing your trades (for better or worse)!
Put another way; you can also see when inter-market relationships are “working” or changing.
For example…
On Friday, the QQQ got off to a very bullish start when it gapped higher out of a consolidation pattern on its 50-day moving average.
It looked like a perfect setup for a big trend day.
Unfortunately, it was quickly hit by a ton of bricks and stalled.
The IVE ETF, on the other hand, climbed higher all day without letting up.
How Could You Have Anticipated The QQQ Would Stall? While The SPY and IVE Remained Bullish?
Here’s what you absolutely need to know…

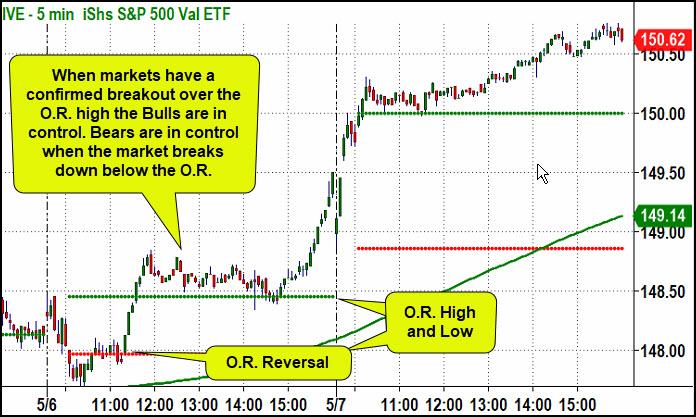
The Opening Range (O.R.) that I’m referring to in this post is the high and low of the first 30 minutes of the day.
After the 30-minute O.R. is established, the basic analysis is…
- Trending days break the O.R. range and run.
- Reversals happen around the O.R. high and low.
- Choppy days get stuck within or around the O.R. range.
That’s a very oversimplified set of rules.
If you watch our O.R. training or spend a few years studying the O.R. live in the markets, you’ll discover there is a lot more to it, but that simple set of rules above will enable you to follow this post.
Secrets of Predicting Market Behavior: Opening Range Applied to Intermarket Analysis.
The Opening Range on multiple indexes simultaneously enables you to predict when the markets are likely to trend or reverse.
Friday’s historic employment report provided a perfect opportunity to demonstrate the power of the Opening Range to figure out which way the market will trend (or not trend), because…
The much anticipated monthly employment report was not just a surprise…
It was a historic miss.
The reported numbers were farther from the analysts’ expectations than any other report in the history of the data!
Everybody got it wrong.
This is where markets recalibrate, and good traders thrive.
It was a perfect day to let the market tell you what it was thinking rather than make any assumptions.
It was a perfect day to apply what you know about the Opening Range, and…
The Opening Range made it clear why the QQQ didn’t trend higher, and it alerted you to expect the QQQ to sell off from its initial bullish surge in the morning, even as other stock indexes trended higher.
The secret to anticipating the market’s next move is to listen to it. It will tell you where it’s going next.
As you may know, if you’re familiar with our Alpha Rotation model that anticipates the big trends in the stock market, the best place to start listening to the “message of the market” is to focus on the relationship between stocks and bonds.
Beware: Market Rotation Is Creating Added Complexity
Warning: Currently, there is an additional factor to consider. There is a massive rotation underway in the market, creating independent and correlated trends in cyclical or value stocks vs. big tech or growth stocks.
One way to see this market rotation is to look at the IVE as proxy for the cyclical stocks and contrast that with the QQQ as the proxy for the mega-cap tech stocks.
I like to look at IVE because it also serves as a more direct comparison to the SPY when evaluating how much of the market’s move results from the ‘cyclical’ rotation, but that’s a topic for another day.
Of course, for interest rates, we’ll look at the TLT (the long bond ETF).
Bonds Are Leading Stocks (Some of Them)
If you were watching the Opening Range in the TLT on Friday, you would have seen why the two stock indexes had such different trends.
Plus, the same insights suggest that there are bigger, longer-term trend risks to be aware of, such as…
Since the middle of February, when the rate of change in the rise of interest rates reached a level that rattled the bullish sentiment of growth stock investors, interest rate expectations have had a strong influence on the direction of the QQQ.
Simply put, TLT falling (which equals interest rates rising), has tended to put pressure on QQQ.
Of course, markets are never that literal or linear.
As a result, when and by how much the QQQ will inversely follow the TLT is always in question.
However, when the relationship is driving market behavior, the savvy trader pays attention!
Pulling It All Together
I often hear traders naively say they don’t think they need the Opening Range because they’re not day traders.
That’s like saying…
“I don’t look at a weather forecast because
I can’t change the weather!”
Here’s what they’re missing.
The Opening Range is not limited to day trading.
More importantly…
The Opening Range can give you unique insight into the condition of the long-term trends driving the markets that are affecting the value of your stock or ETF trades!
And you’ll never see this important insight on daily or weekly charts!
For example…
Look at Friday’s closing data.
You’ll see….
SPY up 0.73%
QQQ up 0.90%
DIA up 0.69%
IWM up 1.26%
IVE up 0.80%
TLT down 0.75%
A natural conclusion would be that stocks liked the employment report and bonds didn’t.
It also appears as if stocks didn’t care about the bonds being down.
But that’s a major mistake!
Look at what happened in the charts below.

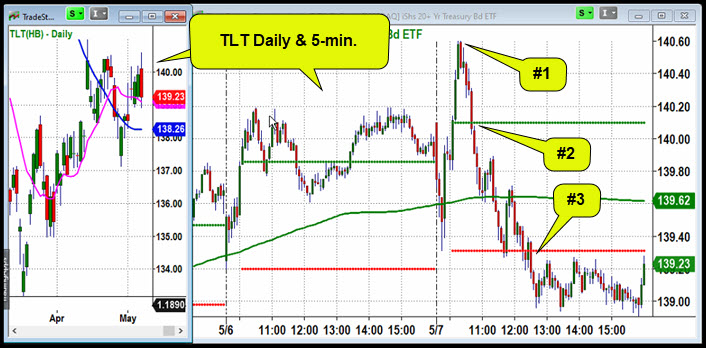
The TLT initially sold off and set the low of the O.R.
Then it reversed and broke out over its O.R. high.
The breakout was bullish, but it rolled over at daily swing high set on 4/23.
In a healthy bullish trend, the TLT would not have retraced back below its O.R. high (point #2).
This “O.R. reversal” (as we teach) was the first sign that bonds were not going to have a bullish trend day.
When TLT then proceeded to make a confirmed O.R. breakdown at point #3, it was an indication that Friday may have a trend down day!
Fortunately for the QQQ, TLT found support at 139, which was Wednesday’s daily low.
Who’s Calling The Shots?
Now, look at how QQQ followed the TLT.
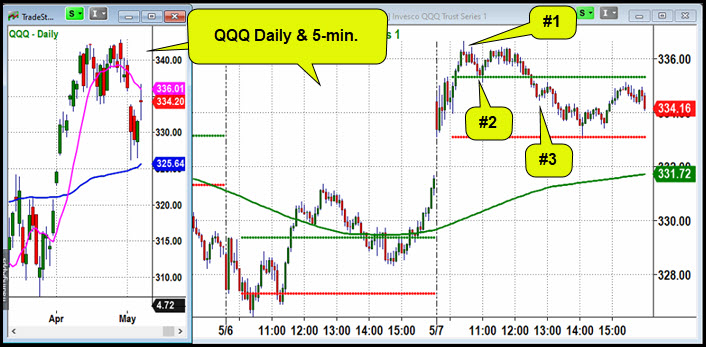
QQQ had a bullish gap higher, but it immediately began to consolidate as TLT moved lower from the open.
It wasn’t until TLT broke out of its O.R. that QQQ could break out over its O.R. high.
Then QQQ peaked at the same time TLT did (point #1).
As TLT broke down below its O.R. high, QQQ held its O.R. high, which is a sign of strength. It even rallied back to its daily high while TLT was trying to hold its O.R. low.
However, TLT’s O.R. bearish breakdown led to the QQQ bearish O.R. reversal (point #3), and with the bonds in “bearish” mode, QQQ sold off, found support at its O.R. low, and remained stuck in its O.R. for the rest of the day.
It was clear that as much as the QQQ was trying to follow through to the upside, its sensitivity to rising interest rates was holding it back.

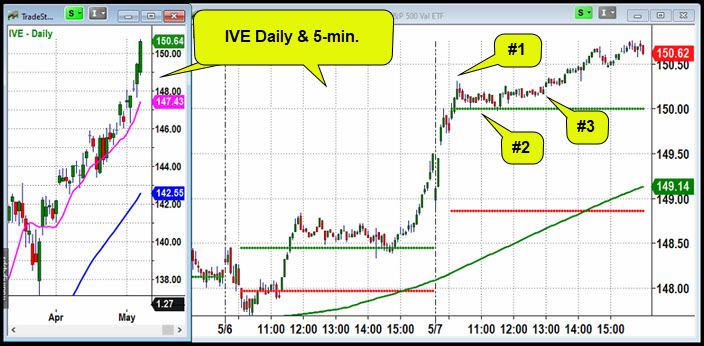
Meanwhile, as you can see in the chart below, IVE, the cyclical or value stocks that are less sensitive to TLT (for now), paused with the weakness in TLT but remained in a bullish mode all day!
In fact, when TLT bounced off the 139 level (around 13:30), IVE took that as a sign that it was safe to extend its bullish trend.

As I stated above…
TLT and QQQ aren’t always going to be so closely in synch, but when they are, a savvy trader pays attention to it.
Armed with the insight that the O.R. provides, you’ll be better able to determine when a market is likely to trend or reverse.
You’ll also be more aware of inter-market relationships that reveal risks and opportunities like the current potential risk to the QQQ if the TLT breaks lower in the near term.
Even more importantly…
When you know how to read market action using the O.R., you’ll know when these relationships are driving market behavior and when they are changing!
It’s not hard to get started.
And once you’ve mastered it…
Applying it only requires a quick glance at the charts.
Give it a try.
