Everyone seems to be focused on Gold recently and seems to be ignoring the real upside potential in Silver. With all the global economic issues, military tensions, geopolitical issues, and other items continually pushed into the news cycles, it is easy to understand why traders and investors may be ignoring Silver.
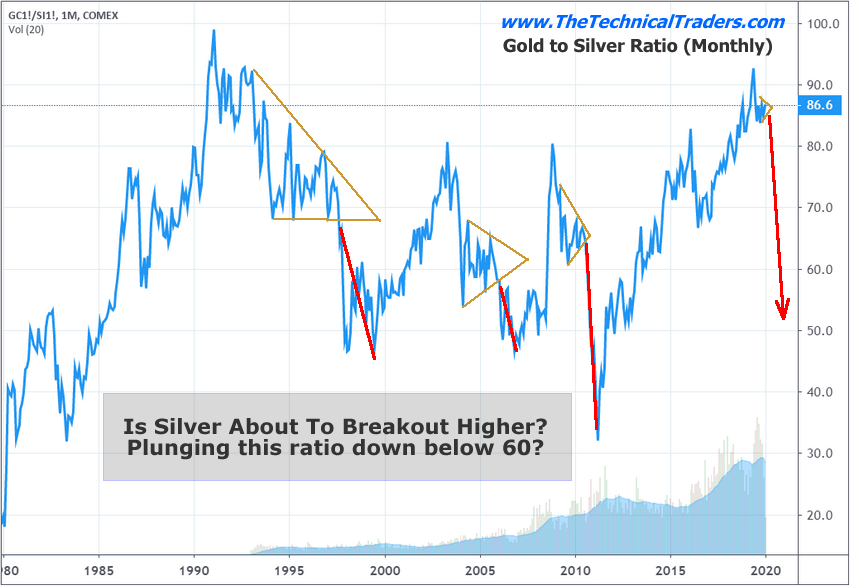
Silver has really not started to move like the other precious metals. Gold is up over 45% since 2016. Palladium is up over 350% since 2016. Silver is up only 29% since 2016. The Gold to Silver ratio is currently at 86.7 – very near to the highest level on record going back over 25 years.

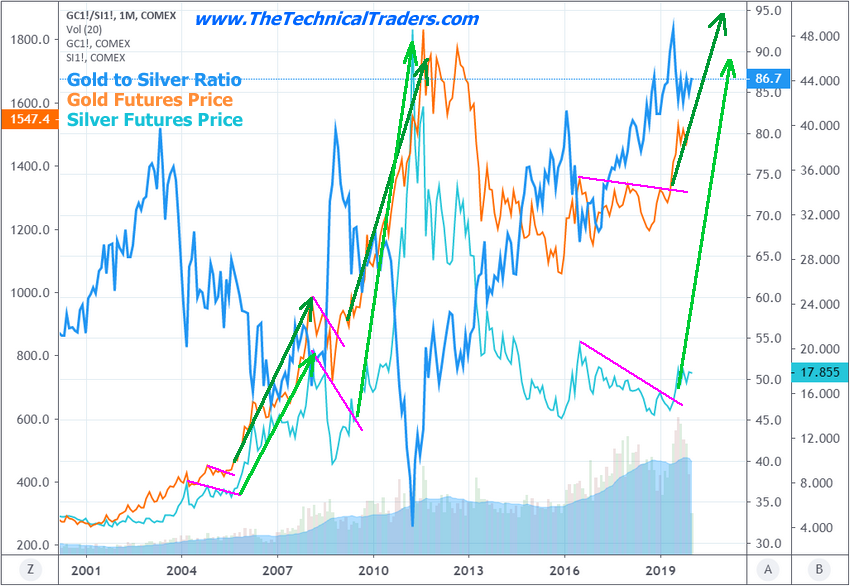
Historically, Silver rallies 6 to 12+ months after Gold begins a price rally. The big break in the Gold to Silver ratio comes at a time when Gold rallies by more than 30% to 60% faster than the price of Silver. In other words, when a major disparity sets up in the price of Gold compared to the price of Silver, then Silver explodes higher – which results in a drop in the Gold to Silver ratio.
Currently, the relative price of Gold to Silver is over 200%. Considering this fact and considering the under-performance of Silver recently, our researchers believe Silver is setting up a massive basing pattern in preparation for an explosive upside move.
Our research team put together this chart to help illustrate the real upside potential in Silver. This Monthly chart highlights the Gold to the Silver ratio (Darker BLUE), the price of Gold (Gold) and the price of Silver (light BLUE) over the past 20 years.
Every time Gold broke a sideways Flag formation and began to rally substantially higher, Silver followed Gold higher 5 to 12 months after with an incredible upside price rally. In 2005, Silver rallied over 100%. In 2009, Silver rallied almost 400%. Now, in 2020, could Silver rally 100%, 200%, 300% or more?

In the recent past, we’ve authored numerous articles about Gold, Silver and precious metals highlighting our expectations going forward. Our incredible research from October 8, 2018, floored many institutional traders and researchers because we were able to accurately predict the future price moves in Gold 9+ months into the future. Take a little time to read some of our earlier research posts
We believe the current setup in Gold and Silver is almost identical to previous setups where Gold rallied on economic or global concerns, prompting a massive disparity ratio between Gold and Silver. We believe Silver is setting up in a massive basing pattern that may be an incredible opportunity for skilled traders.
In Part II of this research post, we’ll highlight why we believe all skilled traders and investors should be paying very close attention to the metals markets, Miners and, in particular, Silver.
As a technical analysis and trader since 1997 I have been through a few bull/bear market cycles, I have a good pulse on the market and timing key turning points for both short-term swing trading and long-term investment capital. The opportunities are massive/life-changing if handled properly.
