
Big Lots Inc.’s (NYSE:BIG) third-quarter fiscal 2017 marked the eighth straight quarter of positive earnings surprise. However, the top line marginally fell short of the Zacks Consensus Estimate after surpassing it in the preceding quarter.
Following the results, management raised fourth quarter and fiscal 2017 earnings guidance but remained somewhat cautious about sales and comparable store sales (comps) performance due to the competitive retail landscape. Nevertheless, cost containment efforts and share buyback activity will continue to cushion the bottom line.
The company’s bottom-line performance has helped this Zacks Rank #2 (Buy) stock to surge 17.3% in the past six months, compared with the industry’s growth of 7.3%.

Let’s Delve Deep
The company delivered adjusted earnings of 6 cents a share that came a penny ahead of the Zacks Consensus Estimate and increased a couple of cents from the year-ago period. Further, earnings surpassed the company’s guided range of 1-5 cents per share.
Net sales came in at $1,110.8 million, missing the Zacks Consensus Estimate of $1,116 million but rising marginally by 0.5% from the year-ago figure. Increase in sales came on the back of comps growth but was marginally overshadowed by lower store count year over year.
Big Lots reported comps growth of 1%. Notably, comps have increased in 13 out of the trailing 15 quarters.
The company’s gross profit grew 0.4% year over year to $443.6 million, while gross margin contracted 10 basis points to 39.9%. Operating profit totaled $5.8 million compared with $2 million reported in the prior-year quarter.
Big Lots, Inc. Price, Consensus and EPS Surprise
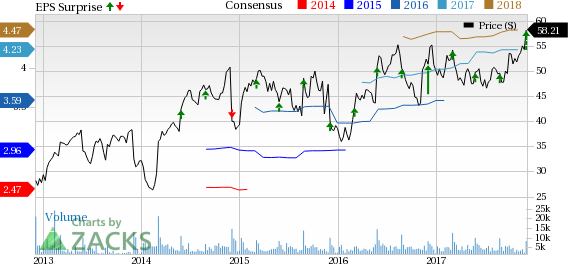
Big Lots, Inc. Price, Consensus and EPS Surprise | Big Lots, Inc. Quote
Other Financial Details
Big Lots ended the quarter with cash and cash equivalents of $58 million, down 2.9% year over year. Inventories were up 0.2% to $1,038.2 million. Total shareholder equity at the end of the quarter was $565.7 million. Long-term obligations under the bank credit facility totaled $371.9 million at the end of the quarter under review.
During the quarter, the company concluded the $150 million share repurchase program approved on Feb 28, 2017. Management incurred capital expenditures of $42 million during the quarter.
In the quarter under review, the company opened 11 outlets and shuttered 14. In the first three quarters of fiscal 2017, the company had opened 19 outlets and closed 25. The company expects to end the fiscal year with a total count of 1,416 stores.
Guidance
Management now projects fiscal 2017 adjusted earnings per share in the band of $4.23-$4.28, up from the earlier guidance of $4.15-$4.25. This represents growth of 16-18% from $3.64 per share recorded in fiscal 2016. Big Lots now anticipates comps growth of approximately 1% with total sales likely to up approximately 2%. Moreover, the company expects cash flow generation of nearly $180 million.
The company now envisions fourth-quarter earnings in the range of $2.35-$2.40 per share, up from previous guidance of $2.30-$2.38, and compared favorably with year-ago figure of $2.26 per share. Comps are projected to be in the range of flat to up 2%.
The Zacks Consensus Estimate for the final quarter and fiscal 2017 is pegged at $2.36 and $4.23, respectively.
Key Picks Apart from Big Lots
Burlington Stores, Inc. (NYSE:BURL) delivered an average positive earnings surprise of 15.2% in the trailing four quarters. It has a long-term earnings growth rate of 17.5% and a Zacks Rank #2. You can see the complete list of today’s Zacks #1 Rank (Strong Buy) stocks here.
Dollar General Corp. (NYSE:DG) delivered an average positive earnings surprise of 1.8% in the trailing four quarters. The company has a long-term earnings growth rate of 11.3% and a Zacks Rank #2.
Dollar Tree, Inc. (NASDAQ:DLTR) delivered an average positive earnings surprise of 7.4% in the trailing four quarters. It has a long-term earnings growth rate of 13.1% and a Zacks Rank #2.
Zacks’ Best Private Investment Ideas
While we are happy to share many articles like this on the website, our best recommendations and most in-depth research are not available to the public.
Starting today, for the next month, you can follow all Zacks' private buys and sells in real time. Our experts cover all kinds of trades… from value to momentum . . . from stocks under $10 to ETF and option moves . . . from stocks that corporate insiders are buying up to companies that are about to report positive earnings surprises. You can even look inside exclusive portfolios that are normally closed to new investors.
Click here for Zacks' private trades >>
Dollar Tree, Inc. (DLTR): Free Stock Analysis Report
Dollar General Corporation (DG): Free Stock Analysis Report
Big Lots, Inc. (BIG): Free Stock Analysis Report
Burlington Stores, Inc. (BURL): Free Stock Analysis Report
Original post
Zacks Investment Research