Most readers know I have issues with the US Census headline data. The data does not add up against itself. When I was a negotiator, one of the tools used is to run your opponent in a loop – and see if the numbers equal to the numbers they submitted.
My analysis of Census economic releases seem to constantly state that the data is worse than the headlines – normally due to the month-over-month change which is headlined. I have looked at 3 major economic releases from Census – and how their month-over-month headlines stack up against the Census current data.
Admittedly, the quibble is not normally whether the data is better or worse than the previous month, but the size of the change. However, from time-to-time I disagree even with the direction of the change.
One should not expect total correlation as the headlines are based on preliminary data. However, with good data gathering and seasonal adjustment methodology – the errors should balance out over a particular year.
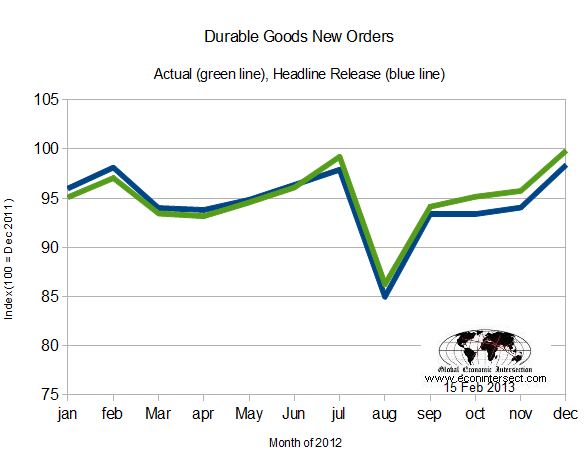
The durable goods headlines seem to correlate reasonably well with the eventual final data. The error over a year resulted in an understatement of gains by 1.5% or an error of a little over 0.1% per month in stating the month-over-month gains. If this was the worst seen in the data and some other things were better, this might not be too bad.
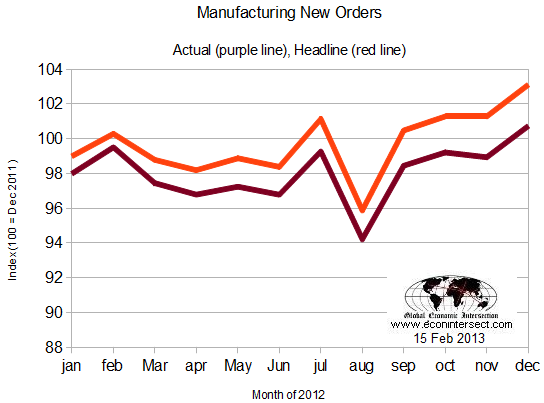
But correlations go down hill from here. Here is Census Manufacturing which the headline month-over-month gains have overstated the real gains on average by approximately 0.2% each month.
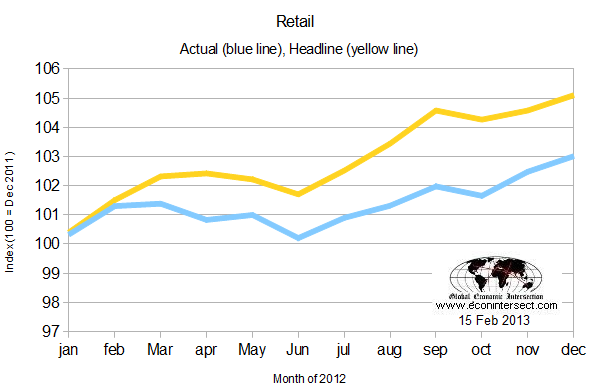
The same amount of overstatement appears in Retail of about 0.2% per month.
You might be thinking that a 0.2% error is not big deal – but it is distorting the real gains by a factor of 2 to 3 over a year. When an economy is chugging along at 2% per year, these overstatements mislead those who extrapolate this data. There appears to be consistent overstating of the month-over-month change during periods of decline.
Am I saying there is a conspiracy to overstate? Nah, even though I tend to believe nothing is as it seems. What I am saying is:
- That Census is sloppy with its seasonal adjusting methodology (algorithms);
- Many believe that overstating economic conditions make consumers and business act in a manner that the overstatement will become self-fulfilling;
- Few consumers of data ever goes back and checks past month-over-month gains – therefore there is little pressure to reign in overstatements;
- No government employee will be reprimanded for saying things are better than what they are, but heaven forbid if they would imply that things are worse than they are. Therefore errors in government analysis will always tend to be overstatements.
Other Economic News this Week:
The Econintersect economic forecast for February 2012 continues to show weak growth. The underlying dynamics have a whiff of improvement – but the zinger in the data was a supply chain contraction. However all the recession markers have evaporated, and one of our alternate methods to validate our forecast remains recessionary (but still only slightly so). Basically, we are saying that not enough products (crude, intermediate, and finished) were moved for sales or manufacture in February.
ECRI now believes a recession began in July 2012. ECRI first stated in September 2011 a recession was coming . The size and depth is unknown. The ECRI WLI growth index value has been weakly in positive territory for over three months – but in a noticeable improvement trend. The index is indicating the economy six month from today will be slightly better than it is today.
Current ECRI WLI Growth Index

Initial unemployment claims fell from 366,000 (reported last week) to 341,000 this week. Historically, claims exceeding 400,000 per week usually occur when employment gains are less than the workforce growth, resulting in an increasing unemployment rate (background here and here).
The real gauge – the 4 week moving average – rose marginally from 350,500 (reported last week) to 352,500. Because of the noise (week-to-week movements from abnormal events AND the backward revisions to previous weeks releases), the 4-week average remains the reliable gauge.
Weekly Initial Unemployment Claims – 4 Week Average – Seasonally Adjusted – 2011 (red line), 2012 (green line), 2013 (blue line)

Bankruptcies this Week:ContinuityX Solutions
Data released this week which contained economically intuitive components (forward looking) were:
- Rail movements are somewhat improving looking at the 4 week average, but longer term trends are still declining.
Weekly Economic Release Scorecard:
Click here to view the scorecard table below with active hyperlinks.

