
Best Dividend Paying Stocks - It’s always good to have stocks with cheap fundamentals and a proven long-term track record.
A cheap valuation is no guarantee for a great return and the past performance doesn’t provide guarantees but this is an overview of the current falling angels in the market. Some of them still have a dominating market position like Chevron (CVX), China Mobile (CHL) or AnheuserBush-Inbev (ABI:EN).
Stocks are mid- and large caps (market capitalization of more than USD 1 billion) with double-digit long-term earnings growth rates. The companies are traded at AMEX, NYSE, NASDAQ and part of the Dow Jones, S&P 500 or Nasdaq Composite. The list is selected by the following criteria and sorted by dividend yield.
Market Capitalization: > 1 Billion
Price/Earnings Ratio: > 0 < 100
Dividend Yield: > 3 < 20
Return on Investment: > 10 < 100
Operating Margin: > 10 < 100
10 Year Revenue Growth: > 8 < 200
10 Year EPS Growth: > 10 < 100
Southern Copper is still the highest yielding company, followed by BP Prudhoe Bay Royalty Trust and Yanzhou Coal Mining.
All three stocks are commodity players. They have benefitted from the big commodity price boom of recent years and suffer now under price declines.
Williams Partners (WPZ) has a market capitalization of $19.99 billion. The company employs 3,658 people, generates revenue of $7.320 billion and has a net income of $1.232 billion. Williams Partners’s earnings before interest, taxes, depreciation and amortization (EBITDA) amounts to $2.273 billion. The EBITDA margin is 31.05 percent (the operating margin is 20.72 percent and the net profit margin 16.83 percent).
Financial Analysis: The total debt represents 42.81 percent of Williams Partners’s assets and the total debt in relation to the equity amounts to 94.98 percent. Due to the financial situation, a return on equity of 7.51 percent was realized by Williams Partners. Twelve trailing months earnings per share reached a value of $1.59. Last fiscal year, Williams Partners paid $3.20 in the form of dividends to shareholders. Sales of WPZ grew by 75.96 percent and earnings by 12.58 percent yearly over the past decade.
Market Valuation: Here are the price ratios of the company: The P/E ratio is 31.55, the P/S ratio is 2.93 and the P/B ratio is finally 1.99. The dividend yield amounts to 6.67 percent and the beta ratio has a value of 1.04.
Potash Corp./Saskatchewan (POT) has a market capitalization of $25.12 billion. The company employs 5,776 people, generates revenue of $7.927 billion and has a net income of $2.079 billion. Potash Corp./Saskatchewan’s earnings before interest, taxes, depreciation and amortization (EBITDA) amounts to $3.595 billion. The EBITDA margin is 45.35 percent (the operating margin is 38.09 percent and the net profit margin 26.23 percent).
Financial Analysis: The total debt represents 22.42 percent of Potash Corp./Saskatchewan’s assets and the total debt in relation to the equity amounts to 41.17 percent. Due to the financial situation, a return on equity of 23.41 percent was realized by Potash Corp./Saskatchewan. Twelve trailing months earnings per share reached a value of $2.58. Last fiscal year, Potash Corp./Saskatchewan paid $0.70 in the form of dividends to shareholders. Sales of POT grew by 13.55 percent and earnings by 43.49 percent yearly over the past decade.
Market Valuation: Here are the price ratios of the company: The P/E ratio is 11.22, the P/S ratio is 3.47 and the P/B ratio is finally 2.76. The dividend yield amounts to 4.43 percent and the beta ratio has a value of 1.10.
China Mobile (CHL) has a market capitalization of $212.74 billion. The company employs 182,487 people, generates revenue of $91.399 billion and has a net income of $21.101 billion. China Mobile’s earnings before interest, taxes, depreciation and amortization (EBITDA) amounts to $41.467 billion. The EBITDA margin is 45.37 percent (the operating margin is 26.86 percent and the net profit margin 23.09 percent).
Financial Analysis: The total debt represents 0.48 percent of China Mobile’s assets and the total debt in relation to the equity amounts to 0.70 percent. Due to the financial situation, a return on equity of 18.84 percent was realized by China Mobile. Twelve trailing months earnings per share reached a value of $5.18. Last fiscal year, China Mobile paid $2.78 in the form of dividends to shareholders. Sales of CHL grew by 15.86 percent and earnings by 12.60 percent yearly over the past decade.
Market Valuation: Here are the price ratios of the company: The P/E ratio is 10.21, the P/S ratio is 2.36 and the P/B ratio is finally 1.81. The dividend yield amounts to 4.14 percent and the beta ratio has a value of 0.35.
Companhia de Bebidas Das Americas (ABV) has a market capitalization of $118.32 billion. The company employs 51,299 people, generates revenue of $14.120 billion and has a net income of $4.662 billion. Companhia de Bebidas Das Americas’s earnings before interest, taxes, depreciation and amortization (EBITDA) amounts to $6.829 billion. The EBITDA margin is 48.36 percent (the operating margin is 43.00 percent and the net profit margin 33.02 percent).
Financial Analysis: The total debt represents 5.80 percent of Companhia de Bebidas Das Americas’s assets and the total debt in relation to the equity amounts to 10.89 percent. Due to the financial situation, a return on equity of 38.58 percent was realized by Companhia de Bebidas Das Americas. Twelve trailing months earnings per share reached a value of $1.47. Last fiscal year, Companhia de Bebidas Das Americas paid $1.26 in the form of dividends to shareholders. Sales of ABV grew by 15.97 percent and earnings by 16.69 percent yearly over the past decade.
Market Valuation: Here are the price ratios of the company: The P/E ratio is 25.70, the P/S ratio is 7.98 and the P/B ratio is finally 8.91. The dividend yield amounts to 3.73 percent and the beta ratio has a value of 0.93.
Take a closer look at the full table of the best dividend paying stocks for August 2013. The average price to earnings ratio (P/E ratio) amounts to 14.50 while the dividend yield has a value of 5.13 percent. Price to book ratio is 3.53 and price to sales ratio 3.01. The operating margin amounts to 30.79 percent. The earnings per share grew by 21.83 yearly over the past decade and sales by 19.28 percent.
The best dividend paying stock list for August 2013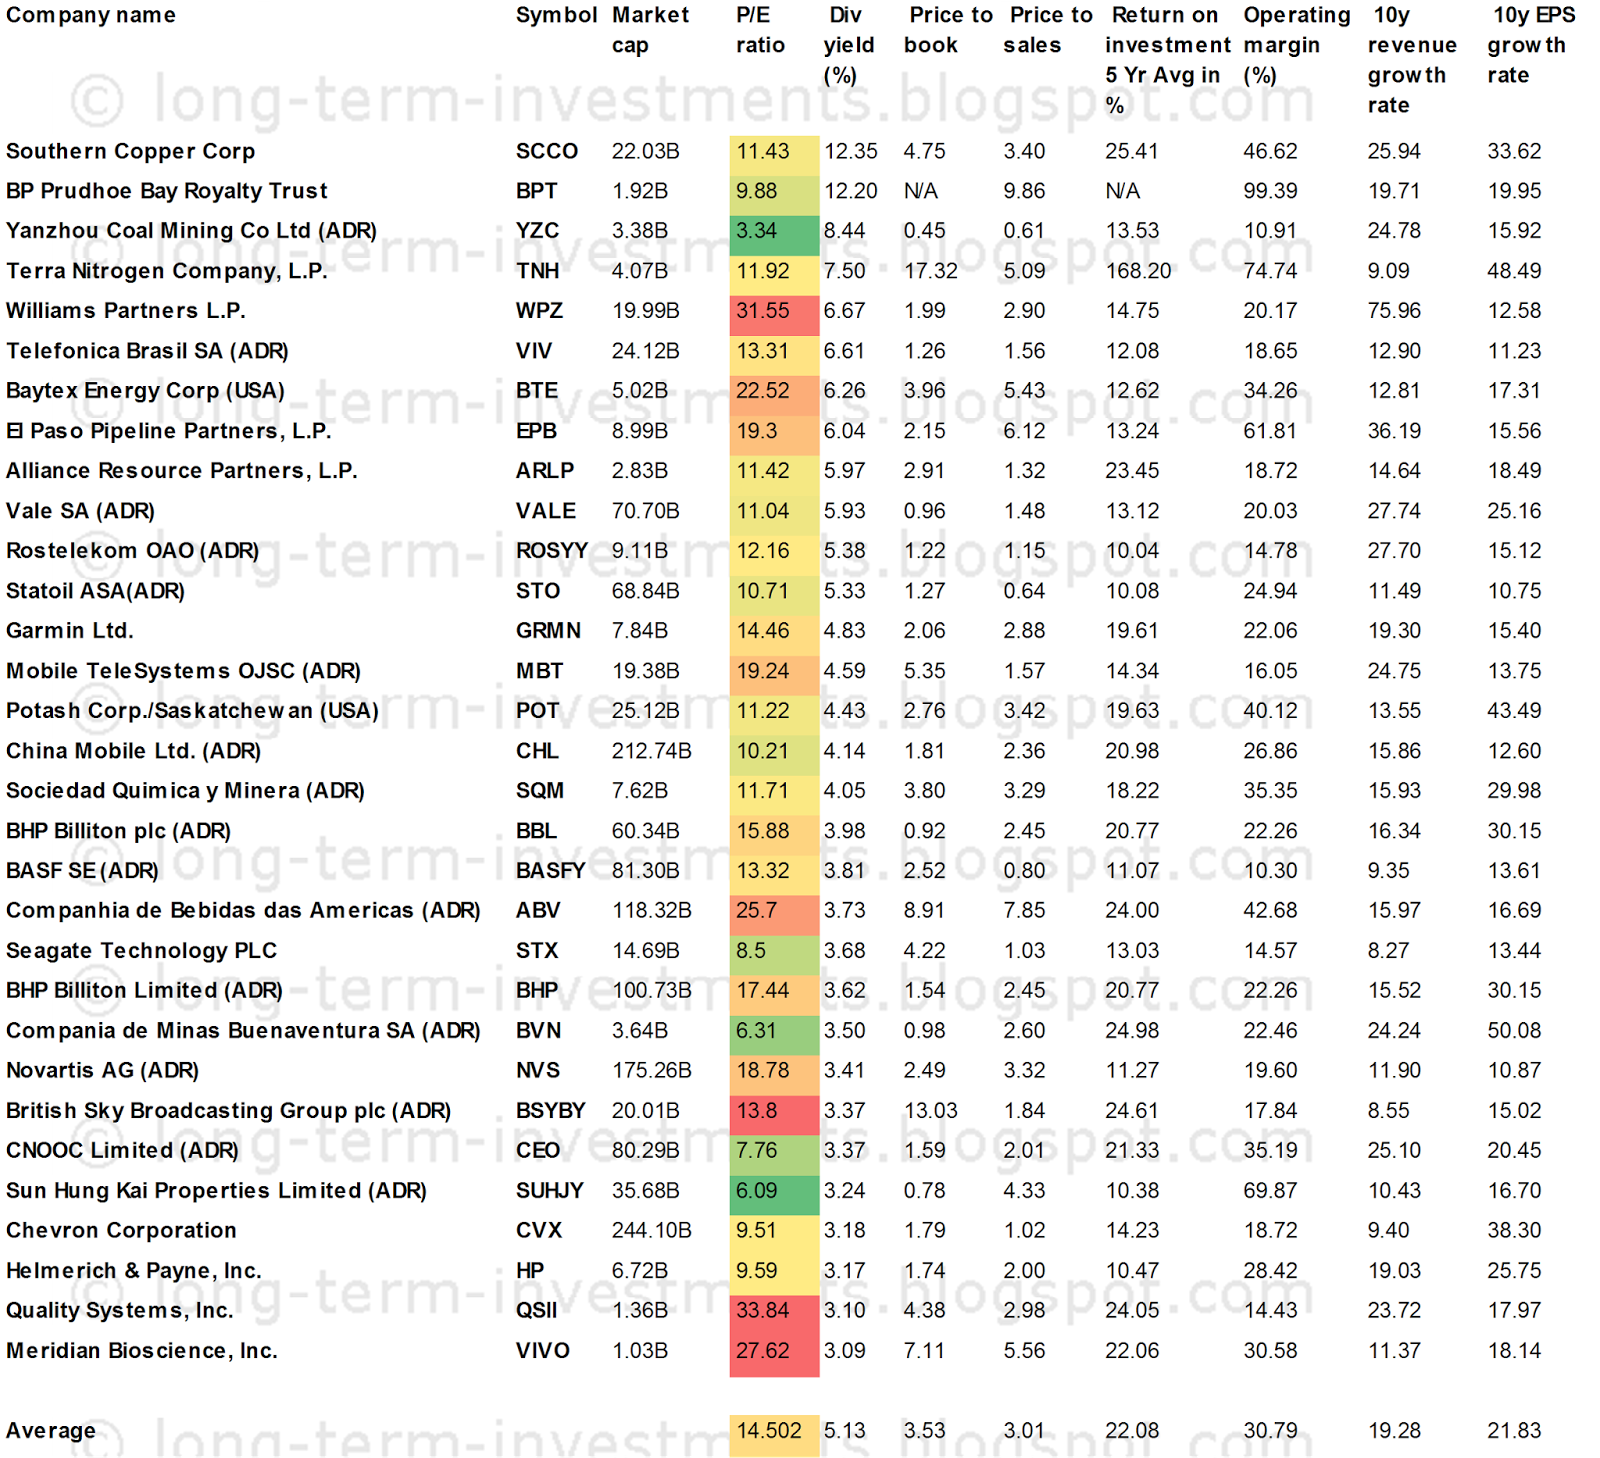
Related Stock Ticker Symbols:
SCCO, BPT, YZC, TNH, WPZ, VIV, BTE, EPB, ARLP, VALE, ROSYY, STO, GRMN,
MBT, POT, CHL, SQM, BBL, BASFY, ABV, STX, BHP, BVN, NVS, BSYBY, CEO,
SUHJY, CVX, HP, QSII, VIVO
Disclosure: I am long ABV. I receive no compensation to write about these specific stocks, sector or theme. I don't plan to increase or decrease positions or obligations within the next 72 hours. For the other stocks: I have no positions in any stocks mentioned, and no plans to initiate any positions within the next 72 hours. I receive no compensation to write about any specific stock, sector or theme.
- English (UK)
- English (India)
- English (Canada)
- English (Australia)
- English (South Africa)
- English (Philippines)
- English (Nigeria)
- Deutsch
- Español (España)
- Español (México)
- Français
- Italiano
- Nederlands
- Português (Portugal)
- Polski
- Português (Brasil)
- Русский
- Türkçe
- العربية
- Ελληνικά
- Svenska
- Suomi
- עברית
- 日本語
- 한국어
- 简体中文
- 繁體中文
- Bahasa Indonesia
- Bahasa Melayu
- ไทย
- Tiếng Việt
- हिंदी
Best Dividend Paying Stocks: August 2013
Latest comments
Loading next article…
Install Our App
Risk Disclosure: Trading in financial instruments and/or cryptocurrencies involves high risks including the risk of losing some, or all, of your investment amount, and may not be suitable for all investors. Prices of cryptocurrencies are extremely volatile and may be affected by external factors such as financial, regulatory or political events. Trading on margin increases the financial risks.
Before deciding to trade in financial instrument or cryptocurrencies you should be fully informed of the risks and costs associated with trading the financial markets, carefully consider your investment objectives, level of experience, and risk appetite, and seek professional advice where needed.
Fusion Media would like to remind you that the data contained in this website is not necessarily real-time nor accurate. The data and prices on the website are not necessarily provided by any market or exchange, but may be provided by market makers, and so prices may not be accurate and may differ from the actual price at any given market, meaning prices are indicative and not appropriate for trading purposes. Fusion Media and any provider of the data contained in this website will not accept liability for any loss or damage as a result of your trading, or your reliance on the information contained within this website.
It is prohibited to use, store, reproduce, display, modify, transmit or distribute the data contained in this website without the explicit prior written permission of Fusion Media and/or the data provider. All intellectual property rights are reserved by the providers and/or the exchange providing the data contained in this website.
Fusion Media may be compensated by the advertisers that appear on the website, based on your interaction with the advertisements or advertisers.
© 2007-2025 - Fusion Media Limited. All Rights Reserved.