The all-cap blend style ranks third out of the twelve fund styles as detailed in my style roadmap. It gets my Neutral rating, which is based on aggregation of ratings of 32 ETFs and 607 mutual funds in the all-cap blend style as of April 24, 2012.
Figures 1 and 2 show the five best and worst-rated ETFs and mutual funds in the style. The best ETFs and mutual funds allocate more value to Attractive-or-better-rated stocks than the worst, which allocate too much value to Neutral-or-worse-rated stocks.
To identify the best and avoid the worst ETFs and mutual funds within the all-cap blend style, investors need a predictive rating based on (1) stocks ratings of the holdings and (2) the all-in expenses of each ETF and mutual fund. Investors need not rely on backward-looking ratings. My fund rating methodology is detailed here.
Investors seeking exposure to the all-cap blend style should buy one of the Attractive-or-better rated ETFs or mutual funds from Figures 1 and 2.
Figure 1: ETFs with the Best & Worst Ratings – Top 5
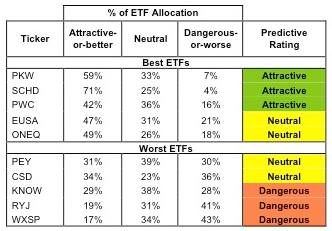
Best ETFs exclude ETFs with less NAV’s less than 100 million.
Sources: New Constructs, LLC and company filings
PowerShares XTF: Dynamic OTC Portfolio [PWO] is excluded from Figure 1 because its total net assets (TNA) are below $100 million and do not meet our liquidity standards.
Figure 2: Mutual Funds with the Best & Worst Ratings – Top 5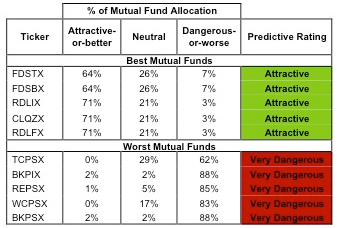
Best mutual funds exclude funds with NAV’s less than 100 million.
Sources: New Constructs, LLC and company filings
PowerShares Buyback Achievers [PKW] is my top-rated all-cap blend ETF and SunAmerica Focused Series, Inc: Focused Dividend Strategy Portfolio [FDSTX] is my top-rated all-cap blend mutual fund. Both earn my Attractive rating.
Guggenheim Wilshire 4500 Completion ETF [EXSP] is my worst-rated all-cap blend ETF and ProFunds: Banks ultra Sector ProFund [BKPSX] is my worst-rated all-cap blend mutual fund. Both earn a Dangerous-or-worse rating.
Figure 3 shows that 540 out of the 2883 stocks (47% of the total net assets) held by all-cap blend ETFs and mutual funds get an Attractive-or-better rating. To earn an attractive-or-better rating, funds must overweight attractive-or-better-rated stocks. Its obvious fund managers are failing to do this since only 4 ETFs and 17 mutual funds in the style earn an Attractive rating.
The takeaway is: mutual fund managers allocate too much capital to low-quality stocks.
Figure 3: All-cap Blend Style Landscape For ETFs, Mutual Funds & Stocks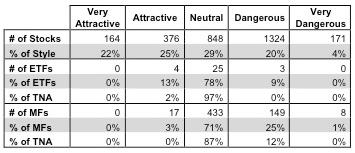
Sources: New Constructs, LLC and company filings
ConocoPhillips [COP] is one of my favorite stocks held by all-cap blend ETFs and mutual funds and earns my Attractive rating. I’m not a fan of most Energy stocks, which is why I’m bearish on Energy sector funds, but COP is a diamond in the rough. COP’s valuation (~72.33) implies that profits will permanently decrease by 50%. With a push toward green energy, it is possible that COP will see a decrease in profits but I’m skeptical that we’ll see a 50% decrease. The upside to COP’s current valuation is profits can decrease up to 49% and the stock will beat market expectations, which will lead to price appreciation. COP offers investors great risk/reward.
Citigroup Inc. [C] is one of my least favorite stocks held by all-cap blend ETFs and mutual funds and earns my Very Dangerous rating. In general, I recommend investors avoid Financials stocks, ETFs, and mutual funds and Citi is a prime example why. Citi reported earnings are misleading, which means they report positive and rising accounting earnings while their economic earnings are actually negative and decreasing. This accounting window dressing is not doing Citi nor the financial industry as a whole any favors when it comes to building back the trust lost during the financial crisis. To justify its current stock price (~33.25), Citi must grow profits by 11.8% annually for 25 years. These are lofty expectation considering that Citi has seen negative profit growth in four of the past five years. I suggest investor look elsewhere if they’re seeking exposure to a Financial stock.
The fund industry offers many cheap funds but very few funds with high-quality stocks, or with what I call good portfolio management.
Figures 4 and 5 show the rating landscape of all all-cap blend ETFs and mutual funds.
Investors need to tread carefully when considering all-cap blend ETFs and mutual funds, as 28 of the 32 ETFs and 590 of the 607 mutual funds in the all-cap blend style are not worth buying.
Our style roadmap report ranks all styles and highlights those that offer the best investments.
Figure 4: Separating the Best ETFs From the Worst Funds 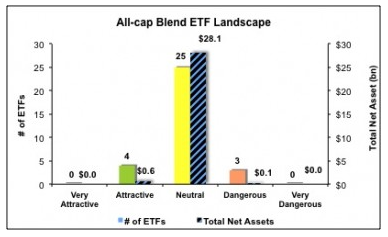
Sources: New Constructs, LLC and company filings
Figure 5: Separating the Best Mutual Funds From the Worst Funds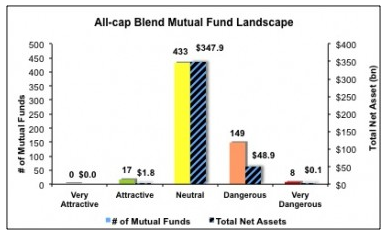
Sources: New Constructs, LLC and company filings
Disclosure: I own COP. I receive no compensation to write about any specific stock, sector, style or theme.
- English (UK)
- English (India)
- English (Canada)
- English (Australia)
- English (South Africa)
- English (Philippines)
- English (Nigeria)
- Deutsch
- Español (España)
- Español (México)
- Français
- Italiano
- Nederlands
- Português (Portugal)
- Polski
- Português (Brasil)
- Русский
- Türkçe
- العربية
- Ελληνικά
- Svenska
- Suomi
- עברית
- 日本語
- 한국어
- 简体中文
- 繁體中文
- Bahasa Indonesia
- Bahasa Melayu
- ไทย
- Tiếng Việt
- हिंदी
Best And Worst ETFs (And Mutual Funds): All-Cap Blend
Published 05/02/2012, 04:04 AM
Updated 07/09/2023, 06:31 AM
Best And Worst ETFs (And Mutual Funds): All-Cap Blend
Latest comments
Loading next article…
Install Our App
Risk Disclosure: Trading in financial instruments and/or cryptocurrencies involves high risks including the risk of losing some, or all, of your investment amount, and may not be suitable for all investors. Prices of cryptocurrencies are extremely volatile and may be affected by external factors such as financial, regulatory or political events. Trading on margin increases the financial risks.
Before deciding to trade in financial instrument or cryptocurrencies you should be fully informed of the risks and costs associated with trading the financial markets, carefully consider your investment objectives, level of experience, and risk appetite, and seek professional advice where needed.
Fusion Media would like to remind you that the data contained in this website is not necessarily real-time nor accurate. The data and prices on the website are not necessarily provided by any market or exchange, but may be provided by market makers, and so prices may not be accurate and may differ from the actual price at any given market, meaning prices are indicative and not appropriate for trading purposes. Fusion Media and any provider of the data contained in this website will not accept liability for any loss or damage as a result of your trading, or your reliance on the information contained within this website.
It is prohibited to use, store, reproduce, display, modify, transmit or distribute the data contained in this website without the explicit prior written permission of Fusion Media and/or the data provider. All intellectual property rights are reserved by the providers and/or the exchange providing the data contained in this website.
Fusion Media may be compensated by the advertisers that appear on the website, based on your interaction with the advertisements or advertisers.
© 2007-2025 - Fusion Media Limited. All Rights Reserved.
