This week Fed Chairman Ben Bernanke critiqued the labor situation in the USA, and concluded:
…..conditions remain far from normal, as shown, for example, by the high level of long-term unemployment and the fact that jobs and hours worked remain well below pre-crisis peaks, even without adjusting for growth in the labor force. Moreover, we cannot yet be sure that the recent pace of improvement in the labor market will be sustained.
It was interesting to me that most pundits and general observers of the employment situation did not have any concerns – and it leads one to wonder why the Chairman would open this Pandora’s box in public. [For those interested in understanding how the Fed looks at the labor market, his speech offered insights.] Most economic projections have uncertainty.
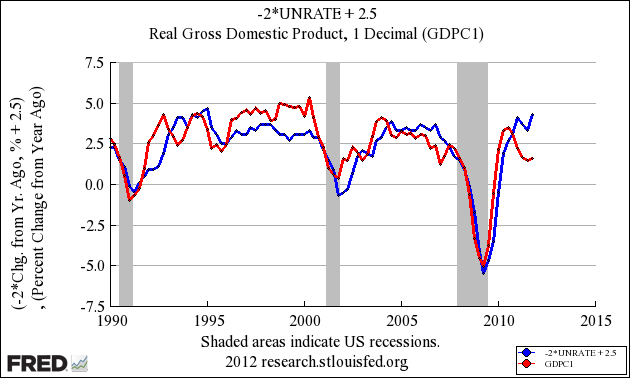
One of the major points the Chairman made was the unexplained deviation of employment from Okun’s law.
That rule of thumb describes the observed relationship between changes in the unemployment rate and the growth rate of real gross domestic product (GDP). Okun noted that, because of ongoing increases in the size of the labor force and in the level of productivity, real GDP growth close to the rate of growth of its potential is normally required just to hold the unemployment rate steady. To reduce the unemployment rate, therefore, the economy must grow at a pace above its potential.
A graphical look at Okun’s law – GDP vs the unemployment rate – showing the divergence beginning in 2010.
Using jobs growth as the metric, the economy should be expanding more rapidly. Karl Smith posted this week:
Based on both the growth in payrolls and the decline in unemploymenthistorical patterns would lead us to expect real GDP growth of around 4% and nominal GDP growth of around 6.5 – 7%.
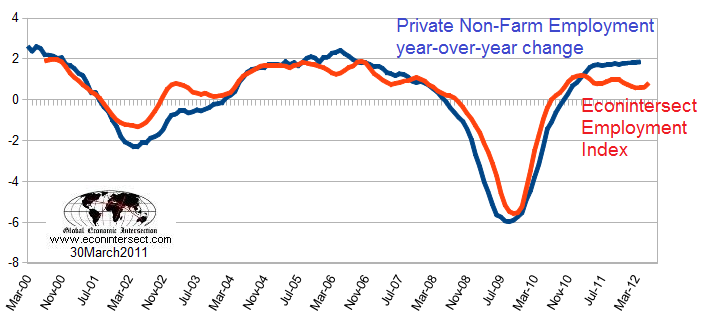
Econintersect uses a non-monetary methodology to forecast jobs growth (a non-monetary approach to Okun’s Law) – yet we are faced with the same puzzle with the deviation since late 2010. Point blank: the economy is producing more jobs than the economic dynamics since 2000 would have indicated.
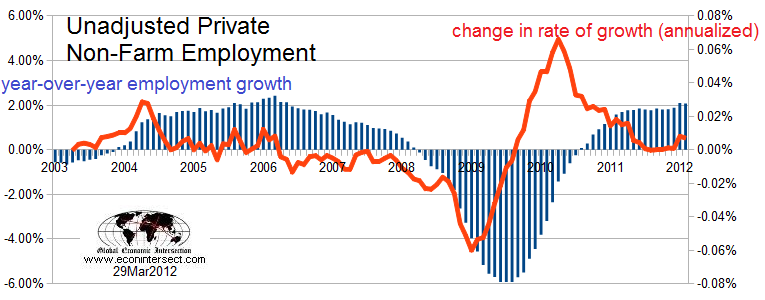
Yet despite Okun’s Law, the jobs grow in 2012 is accelerating and is finally on a trajectory away from a “less good” growth rate. A simple chart using the BLS non-adjusted data demonstrates. When data is analyzed year-over-year it provides a simple seasonal adjustment.
From mid-2010 through December of 2011 – the change in the rate of employment growth remained in a downtrend or a stall pattern.Traction began with the January data – and continued into February.
Two months of improving data is not a trend – but it is definitely not a negative sign. However, Chairman Bernanke seems concerned that when there is a disconnect between expectations and reality – there is something not being understood.
I choose not to look a gift horse in the mouth.
Other Economic News this Week:
The Econintersect economic forecast for April 2012 shows a less good growth. There has been a degradation in our government and finished goods pulse points.
ECRI has called a recession. Their data looks ahead at least 6 months and the bottom line for them is that a recession is a certainty. The size and depth is unknown but the recession start has been revised to hit around mid-year 2012.
This week ECRI’s WLI index value is zero -the best index value since August 2011. This is the tenth week of index improvement. This index is now indicating the economy six months from today will be the same as today.
Initial unemployment claims series (seasonally adjusted) was completely revised from 2007 onwards. Therefore it is ludicrous to even talk about ups and downs this week.Consider this week is a baseline week. Note the Department of Labor press release says the 4 week moving average fell 3,500 to 365,000 (last week the 4 week moving average was 355,000 so in reality this is an increase of 10,000).
Old initial weekly unemployment claims from last week: 
The “new” initial weekly unemployment claims:
Data released this week which contained economically intuitive components (forward looking) were rail movements and CFNAI. Depending on the color of your glasses, one could draw several conclusions – my take is that all is still good but I am at a higher alert level looking for economic outliers as the data is mixed.
Weekly Economic Release Scorecard:
Click here to view the Scorecard table with active links: Bankruptcies this Week: DRI, Thomas Group
Failed Banks this Week: 
- English (UK)
- English (India)
- English (Canada)
- English (Australia)
- English (South Africa)
- English (Philippines)
- English (Nigeria)
- Deutsch
- Español (España)
- Español (México)
- Français
- Italiano
- Nederlands
- Português (Portugal)
- Polski
- Português (Brasil)
- Русский
- Türkçe
- العربية
- Ελληνικά
- Svenska
- Suomi
- עברית
- 日本語
- 한국어
- 简体中文
- 繁體中文
- Bahasa Indonesia
- Bahasa Melayu
- ไทย
- Tiếng Việt
- हिंदी
Ben Bernanke And The Puzzle Of Employment
Published 04/01/2012, 05:48 AM
Ben Bernanke And The Puzzle Of Employment
Latest comments
Loading next article…
Install Our App
Risk Disclosure: Trading in financial instruments and/or cryptocurrencies involves high risks including the risk of losing some, or all, of your investment amount, and may not be suitable for all investors. Prices of cryptocurrencies are extremely volatile and may be affected by external factors such as financial, regulatory or political events. Trading on margin increases the financial risks.
Before deciding to trade in financial instrument or cryptocurrencies you should be fully informed of the risks and costs associated with trading the financial markets, carefully consider your investment objectives, level of experience, and risk appetite, and seek professional advice where needed.
Fusion Media would like to remind you that the data contained in this website is not necessarily real-time nor accurate. The data and prices on the website are not necessarily provided by any market or exchange, but may be provided by market makers, and so prices may not be accurate and may differ from the actual price at any given market, meaning prices are indicative and not appropriate for trading purposes. Fusion Media and any provider of the data contained in this website will not accept liability for any loss or damage as a result of your trading, or your reliance on the information contained within this website.
It is prohibited to use, store, reproduce, display, modify, transmit or distribute the data contained in this website without the explicit prior written permission of Fusion Media and/or the data provider. All intellectual property rights are reserved by the providers and/or the exchange providing the data contained in this website.
Fusion Media may be compensated by the advertisers that appear on the website, based on your interaction with the advertisements or advertisers.
© 2007-2025 - Fusion Media Limited. All Rights Reserved.
