As markets go, they always change and they changed again this past week. Two weeks ago, stocks began to finally act properly and gave us a great week, but then this past week they reverted back to a market of false breakouts and chop. So, we’re back to day-trading mostly once again.
Not that this is a bad thing since you go home with all your cash everyday and we are experiencing some large volatility which means we can make very large gains on a small outlay of cash in a very short amount of time. Day-trading isn’t all that much different than swing trading, it’s just on a much shorter timeframe.
I know many people can’t take advantage of day-trading like I or others who watch the markets all day but for those who can, it can be very rewarding.
The metals showed nice weakness and now seem to have put in the higher low as I talked about here last weekend so let’s check into their charts.

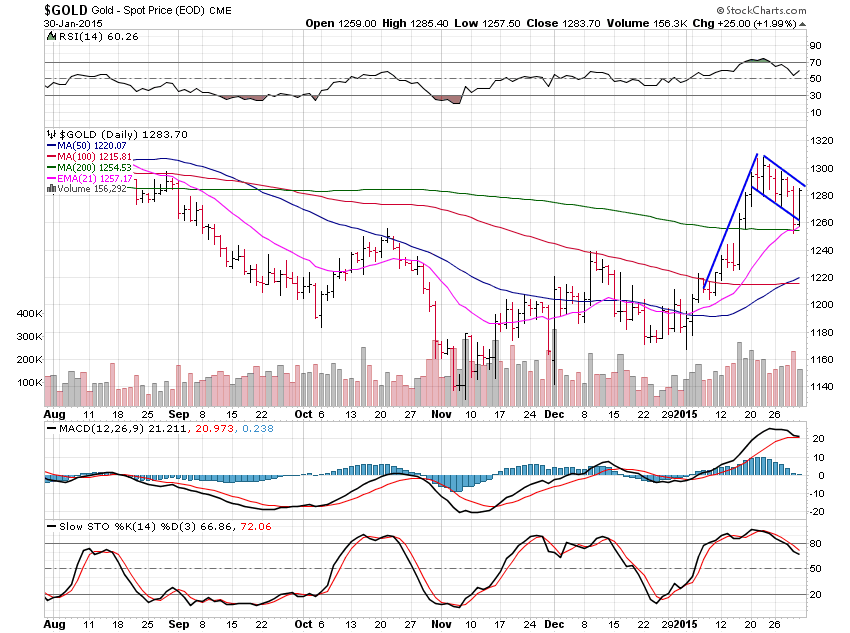
Gold lost 0.80% for the week after a great bounce Friday.
Last week I said gold should roll over and give us a higher low for this move to be sustainable and that is exactly what happened this week.
Honestly, I did think gold would hang out near the 200 day moving average for a few days before rolling back higher but it roared off the 200 day average right away Friday which is great to see.
Volume wasn’t huge but that is fine for now. We’ve got a great bull flag here now and the fact that gold did not want to stay below it is a great sign. I’d prefer to see large volume once we breakout of this bull flag.
Now we’ve got the $1,286 area as buy point and I may take a trade in gold with a move to the $1,320 area on the horizon now. I’m still not 100% sure that a major low is in place yet but in time we can complete this large base and a breakout above the $1,400 area will tell me the major low is in. It still may take a month or more for this to take place.

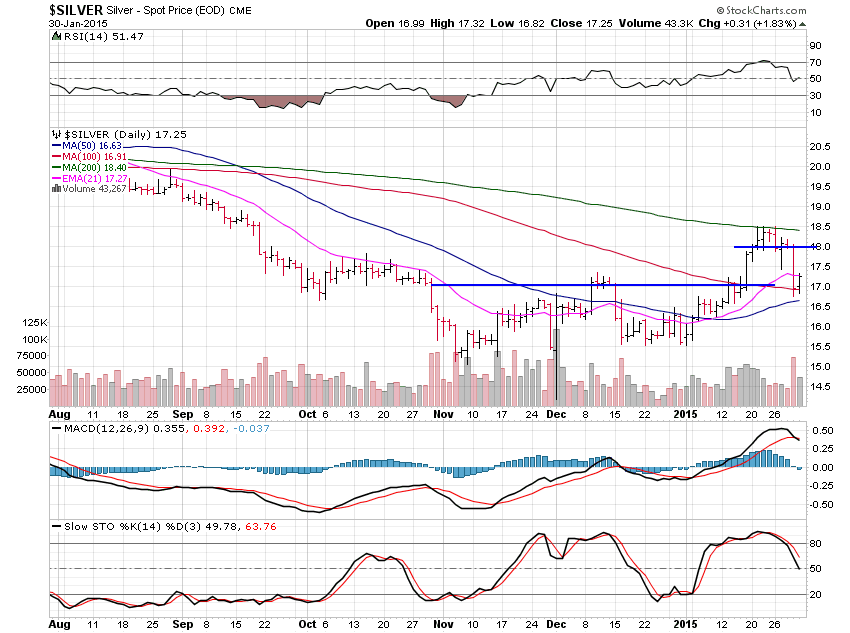
Silver lost a hefty 5.84% this past week but gold is still the leader and the one we should really be focused on. Silver is still having trouble moving above its 200 day moving average and still has some work to do. The $17 level is holding well and silver is turning up to hit the $18 area in the week ahead.
Silver will follow gold.

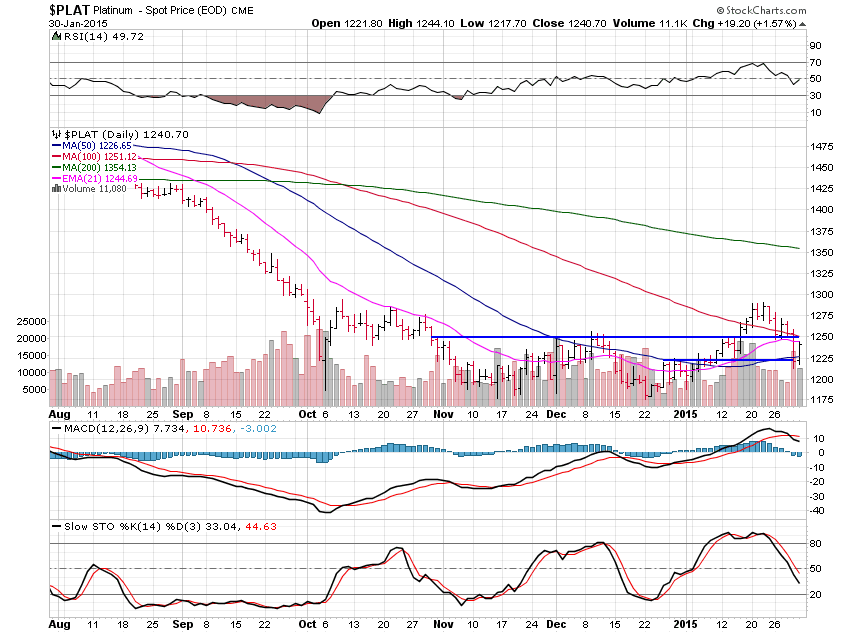
Platinum lost 2.28% for the week but is also turning higher off support at $1,225 and the 50 day moving average. Platinum will continue to follow gold and a break above the $1,250 level would be a buy signal. Platinum now has $1,300 in its sights.
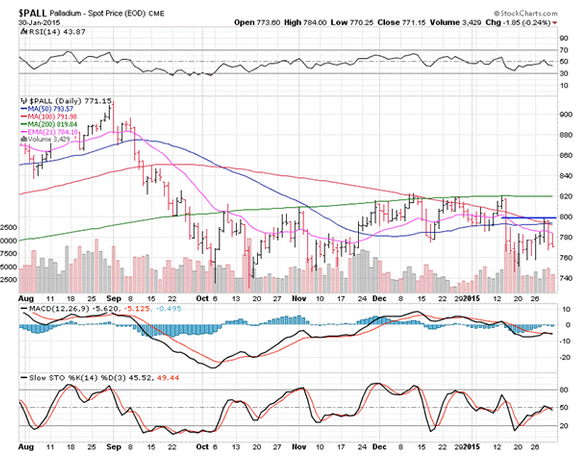
Palladium lost 0.50% this past week and doesn't look as strong as the other precious metals for once. Palladium has acted much better than the other metals but was dragged down by their weakness.
I’m not too sure about palladium here but a move under $760 would not be good while a move above $800 would be very positive but the 200 day average sits just above at $820 and is always a major hurdle for any stock, metal or market.
So while we can make very good money without using much with stocks in this market, metals do look set for a swing trade type of breakout and I am considering trading it now. That said, be weary of false breakouts and take losses quickly if they come.
Also of note is because of time decay, day-trading using options can be much more profitable near the end of the week.
