Suddenly everyone is once again singing the praises of long-term treasuries. And on the face of it, why not? With interest rates seemingly headed to negative whatever, a pure play on interest rates (with “no credit risk” – which I still find ironic since t-bonds are issued by essentially the most heavily indebted entity in history – the U.S. government) stands to perform pretty darn well.
But is it really the best play?


Long-Term Treasuries vs. “Others”
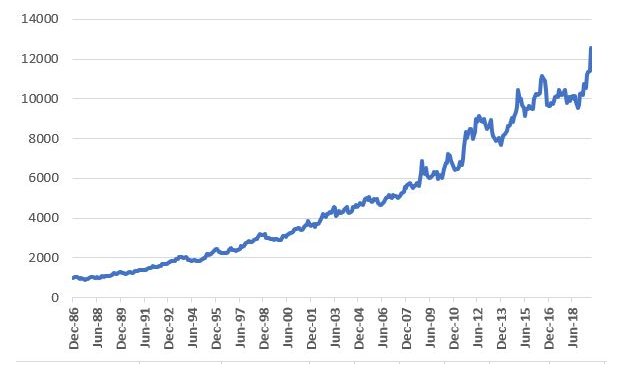
Because a later test will use the Bloomberg Barclays Convertible Bond Index, and because that index starts in 1986 and because I want to compare “apples” to “apples”, Figure 1 displays the growth of $1,000 since 1986 using monthly total return data for the Bloomberg Barclays Treasury Long Index.Not bad, apparently – if your focus is return and you don’t mind some volatility and you have no fear of interest rates ever rising again.
A Broader Approach
Now let’s consider an approach that puts 25% into the four bond indexes below and rebalances every Jan. 1:
*Bloomberg Barclay’s Convertible Bond Index
*Bloomberg Barclays High Yield Very Liquid Index
*Bloomberg Barclays Treasury Long Index
*Bloomberg Barclay’s Intermediate Index
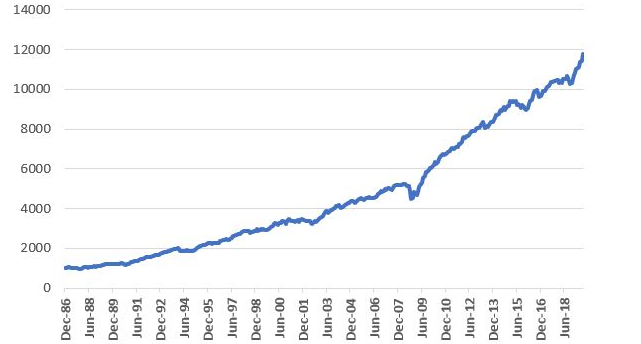
Figure 3 displays the growth of this “index” versus buying and holding long-term treasuries.


As you can see, the 4-index approach:
*Is less volatile in nature (6.8% standard deviation versus 9.0% for long bonds)
*Had a slightly lower maximum drawdown
*And has generated almost as much gain as long-term treasuries alone (it actually had a slight lead over long-term treasuries prior to the rare +10% spurt in long treasuries in August 2019)
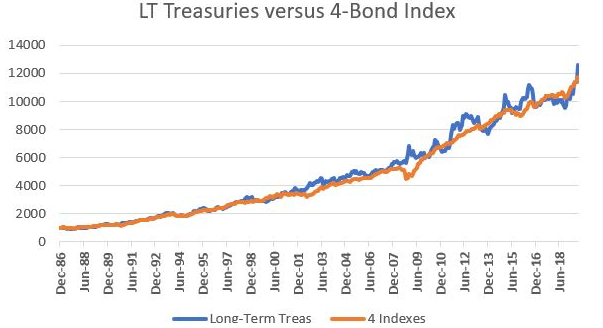
To get a better sense of the comparison, Figure 5 overlays Figures 1 and 3.

As you can see in Figure 5, in light of a long-term bull market for bonds, at times long-term treasuries have led and at other times they have trailed our 4-Bond Index. After the huge August 2019 spike for long-term treasuries, they are back in the lead. But for now, the point is that the 4-Bond Index performs roughly as well with a great deal less volatility.
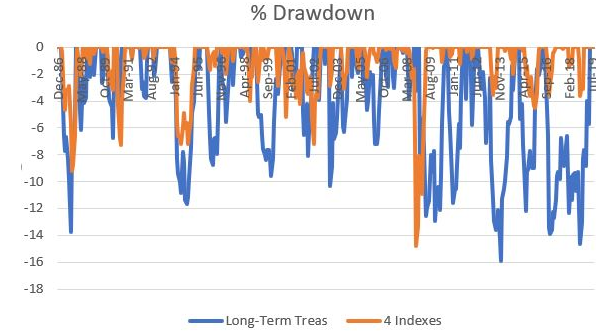
To emphasize this (in a possibly slightly confusing kind of way), Figure 6 shows the drawdowns for long treasuries in blue and drawdowns for the 4-Bond Index in orange. While the orange line did have one severe “spike” down (during the financial panic of 2008), clearly when trouble hits the bond market, long-term treasuries tend to decline more than the 4-Bond Index.

Summary
Long-term treasuries are the “purest interest rate play” available. If rates fall then long-term treasuries will typically outperform most other types of bonds. On the flip side, if interest rates rise long-term treasuries will typically underperform most other types of bonds.
Is this 4-index approach the “be all, end all” of bond investing? Is it even superior to the simpler approach of just holding long-term bonds?
Not necessarily. But there appears to be a better way to use these four indexes – which I will get to in Part II. So stay tuned.
