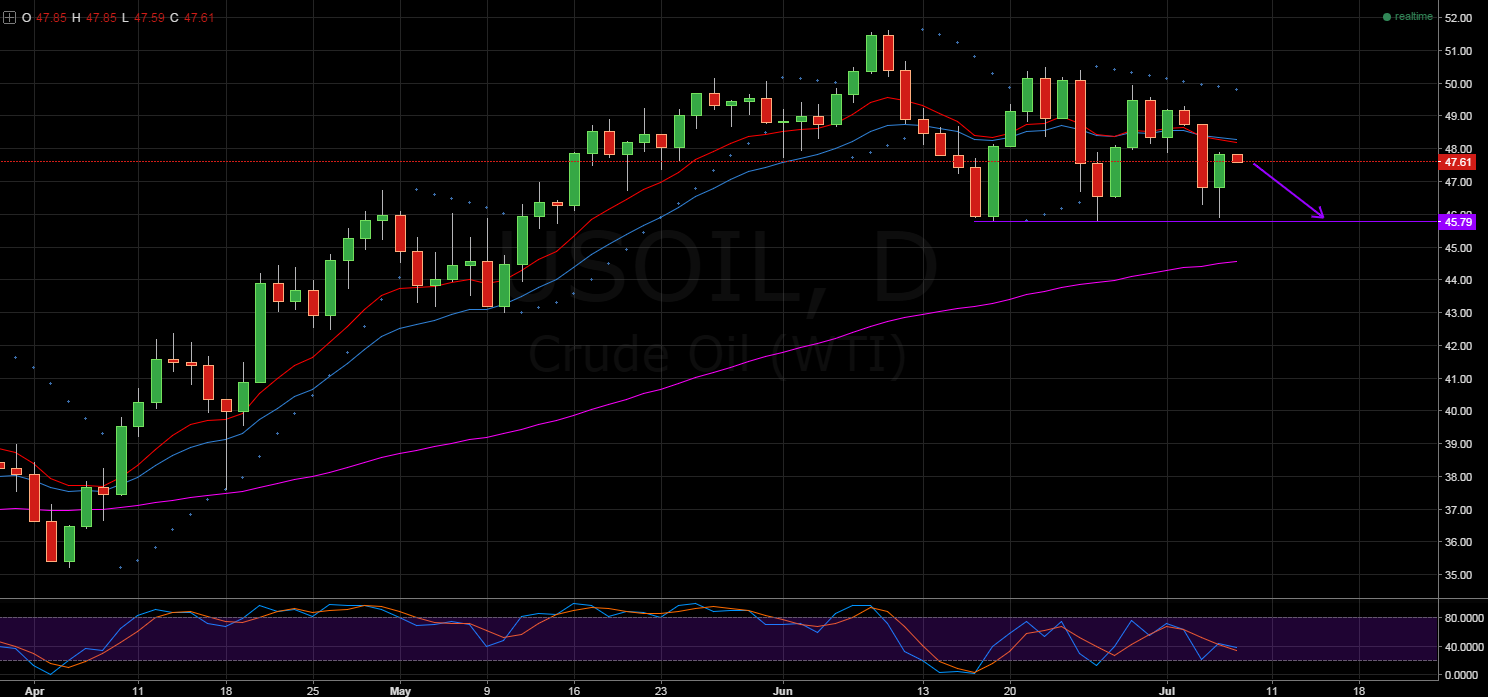
After briefly flirting with the 50.00 handle, oil recently took another plunge back to the ever robust zone of support around the 45.79 handle. In a subsequent manoeuvre, the commodity seems to be making another run at pushing through the $50 price level but might first need to test the downside once again.
Already contending with a strong zone of resistance, oil will likely require another draw in next week’s US Crude Oil Inventories to challenge the long-term high. However, this could mean some solid downside potential for the commodity in the lead up to the indicator release.
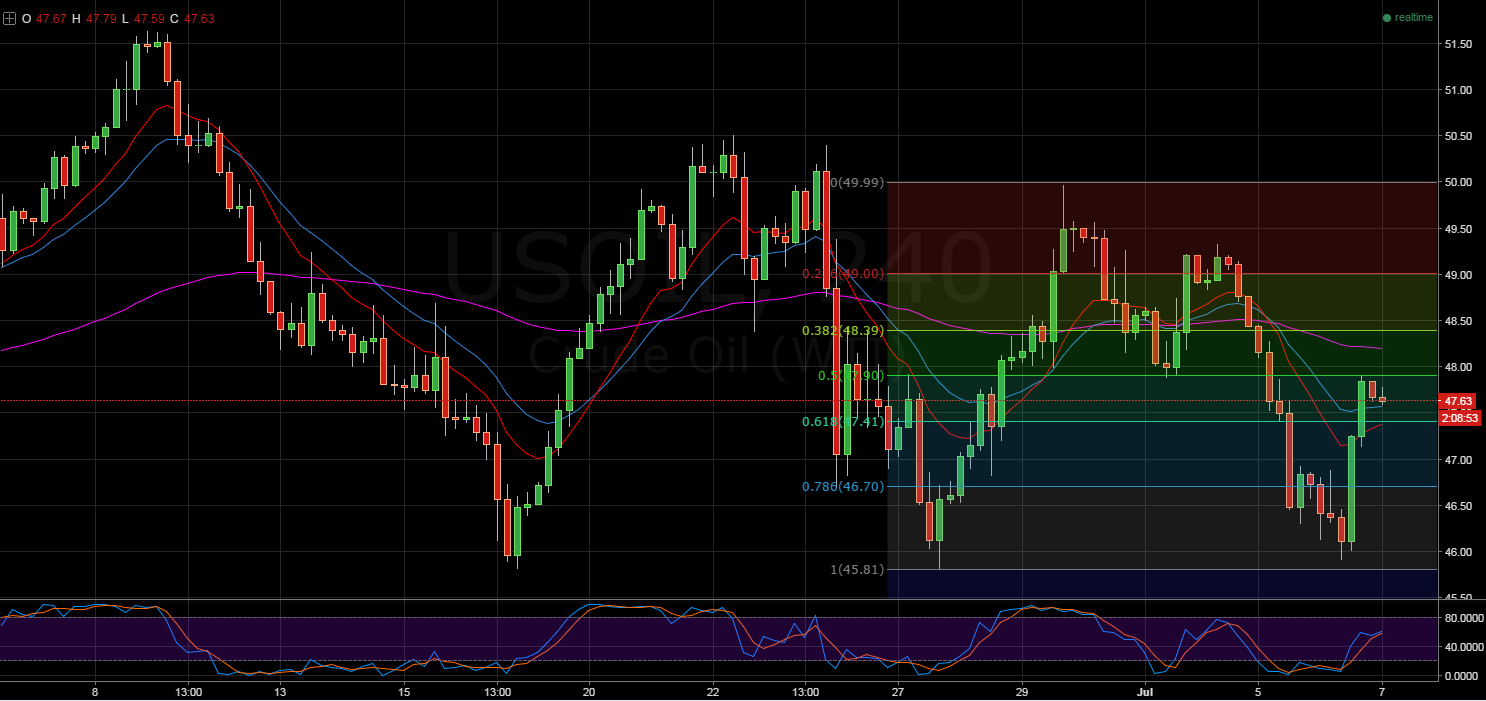
Firstly, as is shown on the H4 chart, oil has recently run into resistance around the 50.0% Fibonacci retracement level. Consequently, the commodity is highly likely to take a tumble back to support around the 45.79 level.
However, the relatively neutral RSI and stochastic oscillator readings are not currently capping the upside which could see the 48.39 price become the true point of inflection. Moreover, this level is almost perfectly in line with the daily pivot point at 48.33 so one shouldn’t rule out another small rally in the coming session.

This being said, it remains highly unlikely that oil can break through the 38.2% Fibonacci level in the absence of a major news event on par with the OPEC Doha talks or a large slip in dollar strength.
As a result, even in the event that the commodity does rally higher, it should ultimately fall back to the 45.79 level over the next week. Supporting this move is both the H4 and daily EMA activity which is, by and large, bearish in nature.

EMA’s are not the only technical indicator signalling that oil is ready to move lower, the daily Parabolic SAR reading remains bearish. As a result, a slip back to support is looking increasingly likely ahead of what could be a decent push towards the 50.0 handle midway through next week.
Any challenge to the long-term high would almost entirely be the consequence of another draw in the US Crude Oil Inventories result. Such was the case only last week where a 4.05M decrease in the inventories data saw a spike in oil prices up to an intra-day high of 49.97.
Ultimately, the commodity is poised to probe the 45.79 level once again before any serious upside breakouts from the consolidating phase occur. However, whether oil has already reversed or if it has the momentum to see the 48.39 level tested first is still somewhat unclear.
This being said, with the notable exception of the RSI and stochastic oscillators, technicals tend to be in agreement that the reversal has already occurred. As a result, the commodity should now be making its way back to support in anticipation of the US Crude Oil Inventories result which could see it soar back to the $50 market once more. How long it can stay there is another question entirely however.
