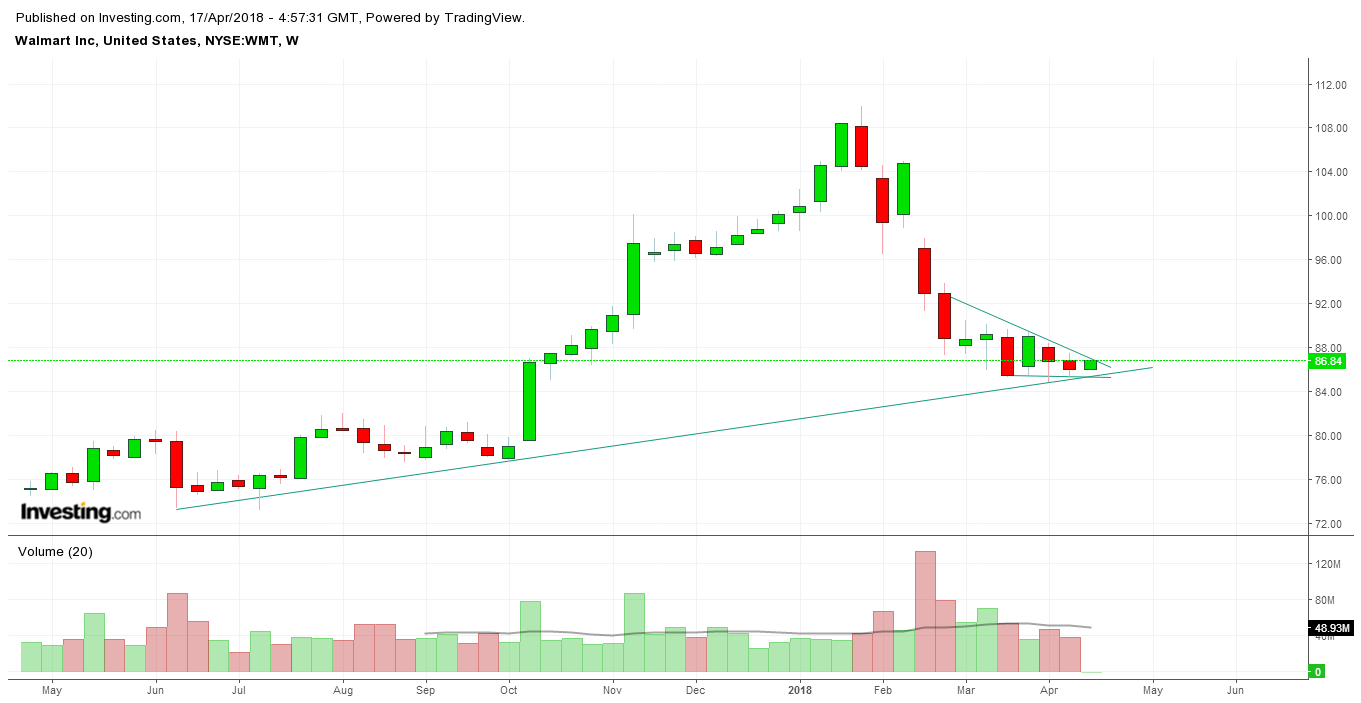
Several indicators are showing bearish signals on Wal-Mart (NYSE:WMT) ranging from daily to monthly charts. The stock price has been recently trading below its moving averages (20 through 200) along with weak RSI, price range in the lower Bollinger Band® area, and range trading since its recent fall to bearish territory (20%+ off its year high).
With stronger than expected wage growth in January and, more recently, international trade woes resulting from tarrifs and tough rhetoric from the Trump administration, WMT has experienced some seriously rough waters only to stabilize in the last few weeks in a $5 range channel between $90 and $85. This is a key long-term support level for the retailer. However, signs are showing that a breakdown in price may occur over the next couple weeks which will signal even greater depth for the consumer giant.
WMT chart below shows a bearish descending triangle along with long-term support trend line.

