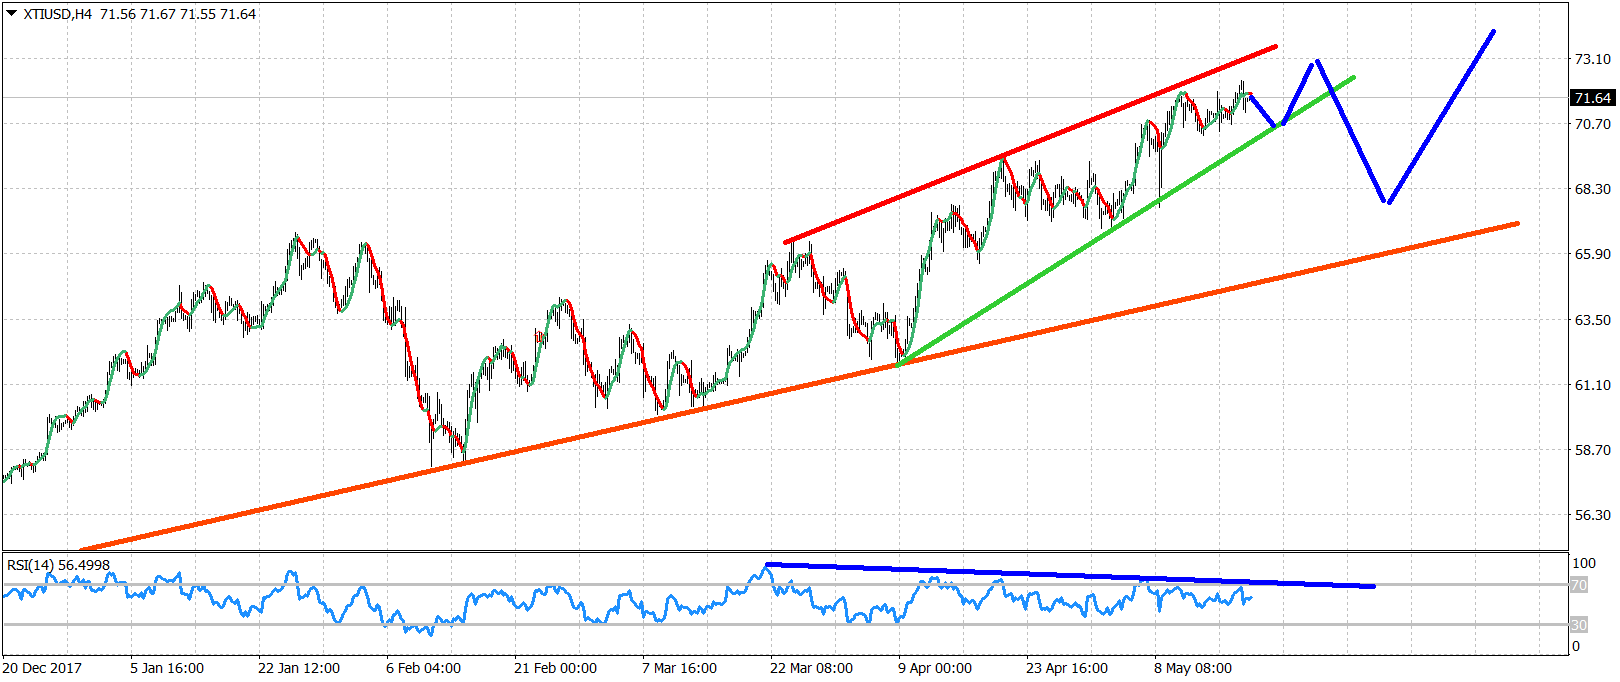
Oil prices are trading inside a rising wedge pattern. In the chart below we also observe the bearish warning signs by the RSI divergence in the 4 hour chart. Support is at $70. A break below it will confirm the wedge is broken and we should at least pull back a couple of $$.
However I can see another new higher high from a bounce at $70.50-$71 and then the break of the wedge for a pull back towards $68-69 minimum. Resistance is at $73-$73.50 so a move towards the upper wedge boundary could be a nice short-term bearish opportunity.
- Short near $73-73.50. Tight stop, playing the rejection from the upper boundary.
- Short on a break of $70. Playing the wedge break down.
- Long near $70.30 with $70-69.70 stop targeting 73. Strategy wants price to continue to respect wedge boundaries for new highs.
Disclosure: None of the information or opinions expressed in this blog constitutes a solicitation for the purchase or sale of any security or other instrument. Nothing in this article constitutes investment advice and any recommendations that June be contained herein have not been based upon a consideration of the investment objectives, financial situation or particular needs of any specific recipient. Any purchase or sale activity in any securities or other instrument should be based upon your own analysis and conclusions.

