The AUD USD weekly trend turned down a couple of weeks ago when the currency pair crossed the swing bottom at 1.0597. After a few attempts on the daily chart to retrace the break, short-traders finally pressed the market enough to trigger a sharp break into an uptrending Gann angle from the October 2011 bottom at .9387.
This week’s low is 1.0335. This price is .0012 below the uptrending Gann angle at 1.0347. Oversold conditions or profit-taking may have led to the technical bounce after this price was tested, but the turnaround was hardly strong enough to form a closing price reversal bottom or even suggest that a change in trend to up was likely.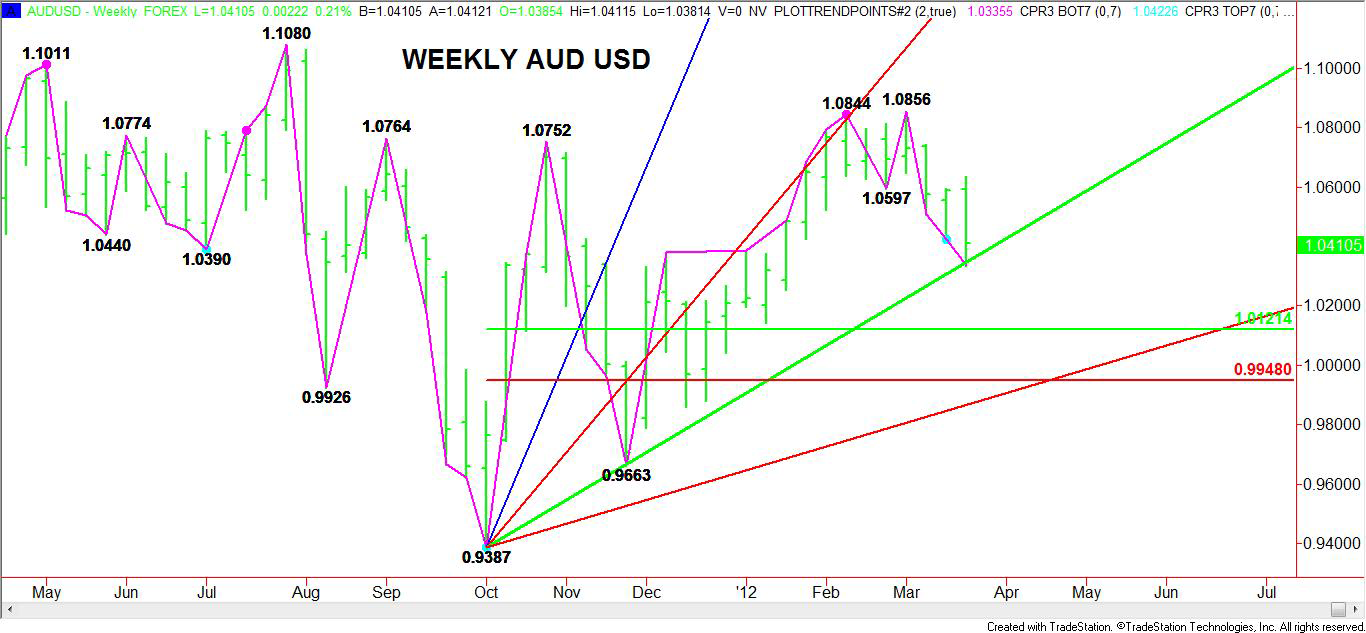 AUD/USD" title="Weekly-AUD/USD" width="1366" height="633">
The chart pattern suggests that there is plenty of room to the downside if 1.0347 can be taken out with conviction. This is a fancy way of saying “I’d like to see increasing volatility and rising volume on the breakout.” Even if the AUD USD cannot break this Gann angle on Friday, a close below 1.0387 will put the market on the bearish side of the uptrending angle which moves up by .004 next week.
With the main trend down and the market getting pressure from traders dumping higher yielding assets because of a weakening economy in China, the AUD USD seems poised to drop even further over the near-term. Based on the main range of .9387 to 1.0856, traders should start anticipating the possibility of a 50 percent or more retracement of this range. If short-sellers hit this market with fervor then expectations are for a possible break into 1.0121 to .9948. Price and time analysis suggests that a move to .9948 is possible by the week-ending April 20.
Even if today the AUD USD trades rangebound, traders should remember to watch for a close below 1.0387. If this occurs then be ready from the get-go next week because the market will be on the weakside of an important Gann angle and in a position to sell-off sharply.
- English (UK)
- English (India)
- English (Canada)
- English (Australia)
- English (South Africa)
- English (Philippines)
- English (Nigeria)
- Deutsch
- Español (España)
- Español (México)
- Français
- Italiano
- Nederlands
- Português (Portugal)
- Polski
- Português (Brasil)
- Русский
- Türkçe
- العربية
- Ελληνικά
- Svenska
- Suomi
- עברית
- 日本語
- 한국어
- 简体中文
- 繁體中文
- Bahasa Indonesia
- Bahasa Melayu
- ไทย
- Tiếng Việt
- हिंदी
Bearish Outlook For AUD/USD According To Weekly Chart
Published 03/23/2012, 03:41 AM
Updated 05/14/2017, 06:45 AM
Bearish Outlook For AUD/USD According To Weekly Chart
Latest comments
Loading next article…
Install Our App
Risk Disclosure: Trading in financial instruments and/or cryptocurrencies involves high risks including the risk of losing some, or all, of your investment amount, and may not be suitable for all investors. Prices of cryptocurrencies are extremely volatile and may be affected by external factors such as financial, regulatory or political events. Trading on margin increases the financial risks.
Before deciding to trade in financial instrument or cryptocurrencies you should be fully informed of the risks and costs associated with trading the financial markets, carefully consider your investment objectives, level of experience, and risk appetite, and seek professional advice where needed.
Fusion Media would like to remind you that the data contained in this website is not necessarily real-time nor accurate. The data and prices on the website are not necessarily provided by any market or exchange, but may be provided by market makers, and so prices may not be accurate and may differ from the actual price at any given market, meaning prices are indicative and not appropriate for trading purposes. Fusion Media and any provider of the data contained in this website will not accept liability for any loss or damage as a result of your trading, or your reliance on the information contained within this website.
It is prohibited to use, store, reproduce, display, modify, transmit or distribute the data contained in this website without the explicit prior written permission of Fusion Media and/or the data provider. All intellectual property rights are reserved by the providers and/or the exchange providing the data contained in this website.
Fusion Media may be compensated by the advertisers that appear on the website, based on your interaction with the advertisements or advertisers.
© 2007-2025 - Fusion Media Limited. All Rights Reserved.