Bear markets matter, and they matter much more than you think. (Read Part 1 Here)
In part-1, we discussed the differences between a “correction” and a “bear market.” But what is often missed by mainstream analysis is the long-term damage done to investor’s financial outcomes.
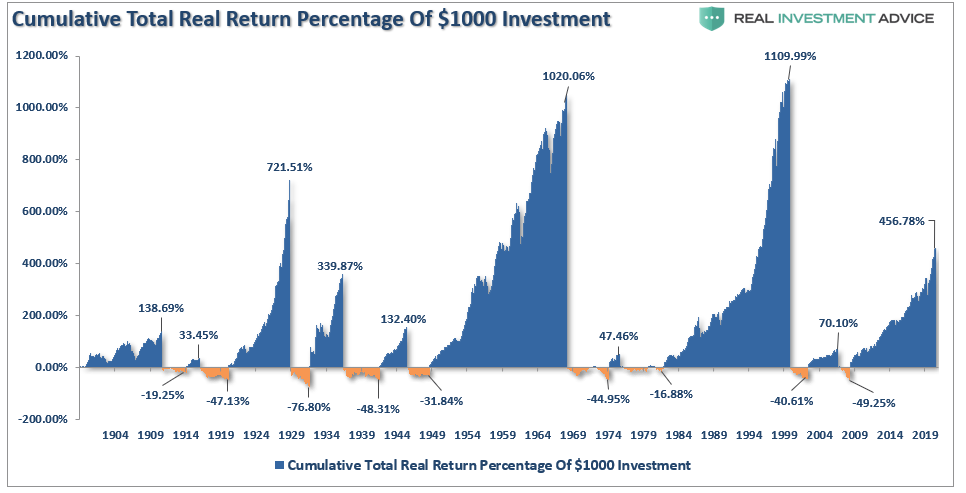
Now and then, you will see a version of the following chart floating around suggesting that over the long-term, “bear markets” don’t matter.
If you only do a cursory analysis of the chart, such would undoubtedly seem to be the case.
The problem is the analysis is exceptionally deceptive due to how math works.
It’s The Math
Notice that the chart uses percentage returns. As noted, that is a deceptive take if you don’t examine the issue beyond a cursory glance. Let’s take a look at a quick example.
Let’s assume that an index goes from 1000 to 8000.
- 1000 to 2000 = 100% return
- From 1000 to 3000 = 200% return
- The next 1000 to 4000 = 300% return
- …
- The final 1000 to 8000 = 700% return
No one would argue that a 700% return on their money wasn’t fantastic.
So, why should you worry about a correction when you just gained 700%. Right?
The problem with using percentages to measure an advance is that there is an unlimited upside. However, you can only lose 100%.
In our example, while our hypothetical investor garnered a 700% return, a 100% loss reverses that gain to zero. Nothing. Zip. Nada.
That is the problem of percentages.
Valuations & Forward Returns
As noted in Part-1, the other issue investors must account for over the long term is inflation. The first chart above is the inflation-adjusted S&P index. For all examples in this article, I am using Dr. Robert Shiller’s monthly data for consistency.
As we discussed, the three most important factors are drawdowns, inflation, and life expectancy.
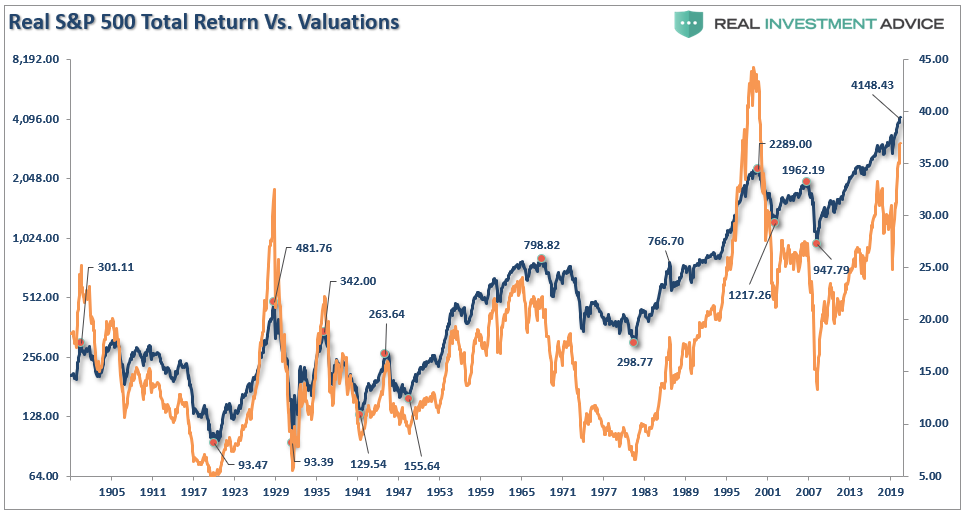
Of course, these long periods of very low returns are a function of valuations.
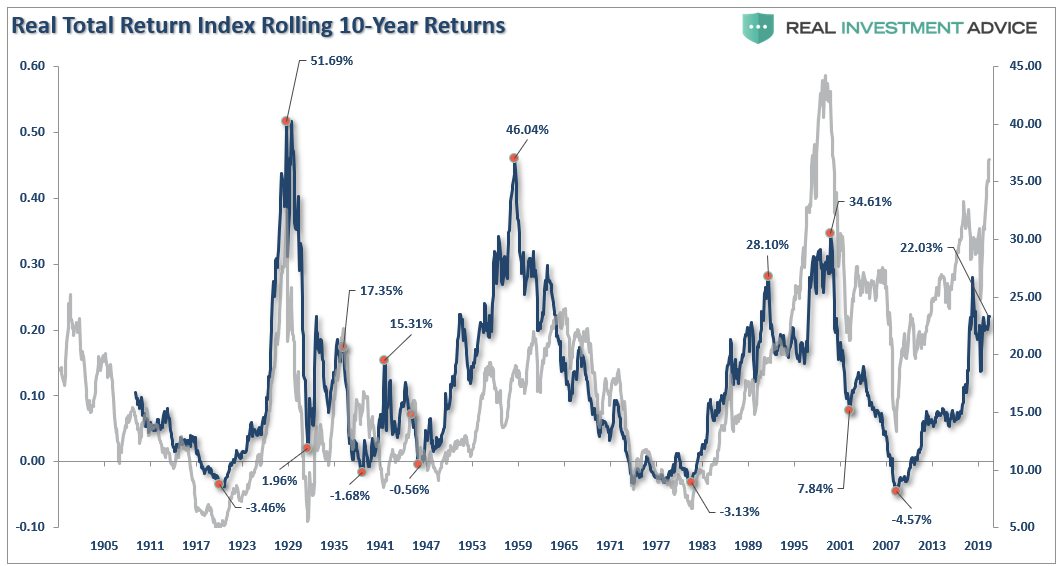
While it may “appear” that investing your money will assure you a return over time, the problem is there are extended periods where returns have been close to zero and even negative.
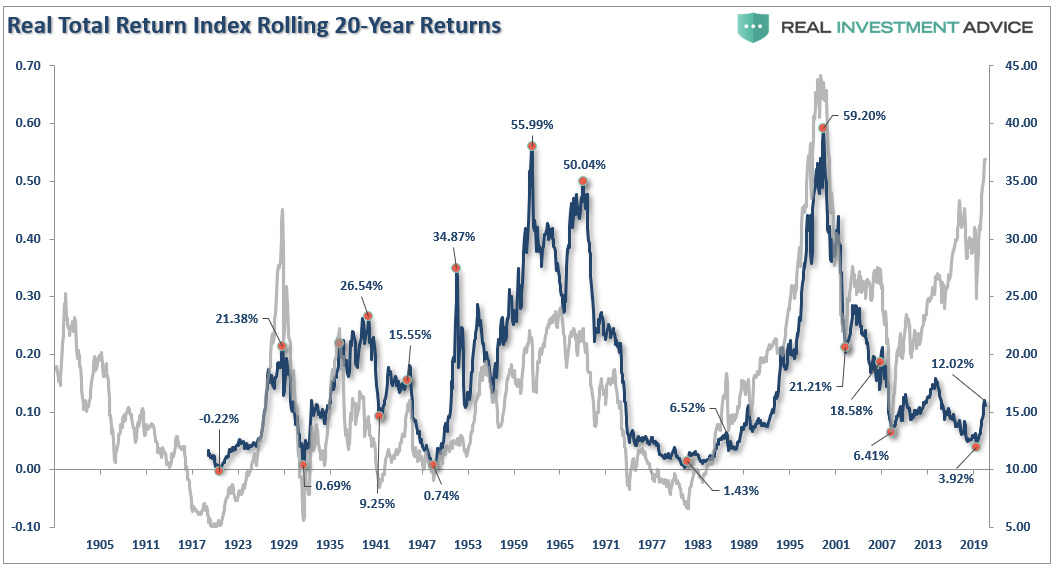
The two charts below show the inflation-adjusted total (dividends included) return over both 10-year and 20-year periods.
You will notice that in both charts there are very long periods of near-zero or negative returns. The reason is that declines in markets from previous peaks erased most, if not all, of the preceding gains.
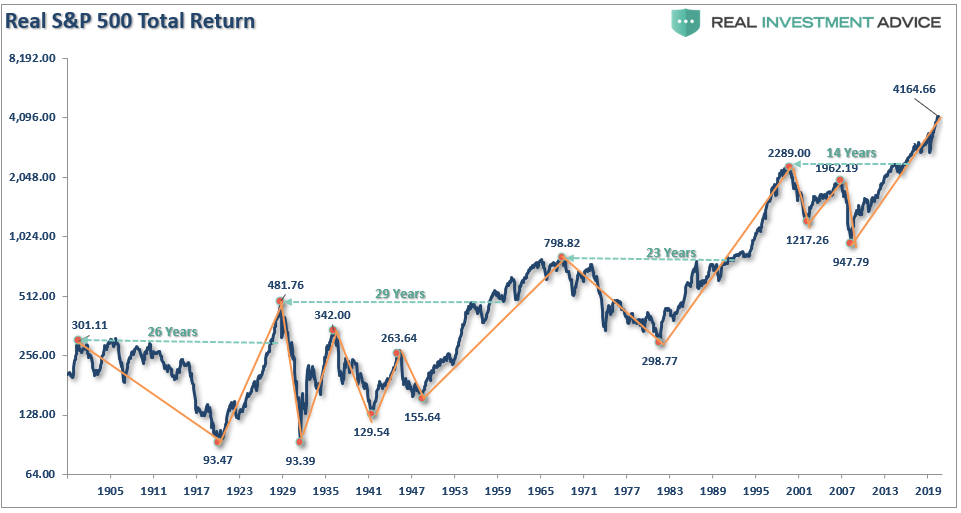
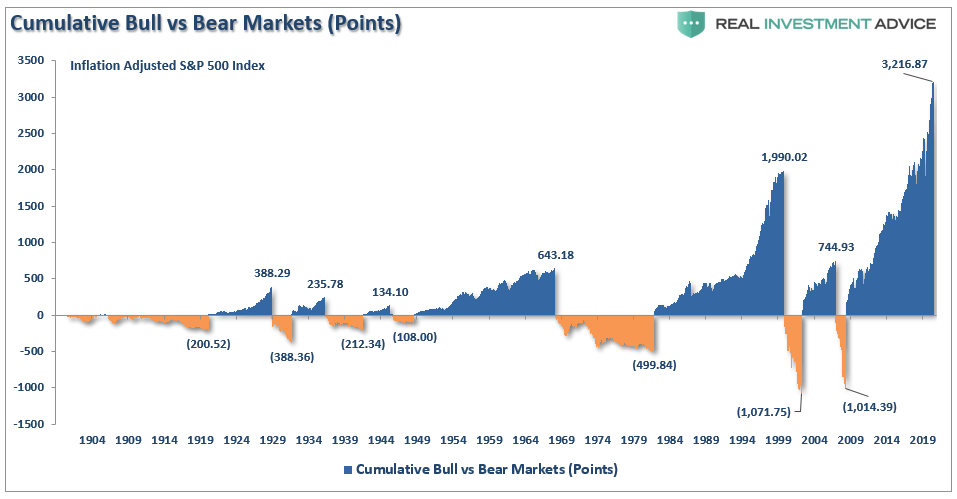
Therefore, if we remodel the “percentage” chart above to reflect each cycle’s “point” gains and losses, the damage becomes apparent. As shown in the chart below, a large chunk of each preceding “bull market” advance has eventually gotten reversed by the subsequent decline.
While many suggest that simply ignoring “bear markets” is survivable in the long run, that brings into question just how long is “the long-run.”
When You Start Matters
Investing for the long term is essential. However, as noted above, there are exceptionally long periods in market history that have denoted sub-par returns.
Over the last 120-years, the one factor that denotes the success or failure of the investment journey has been “valuations” when you started. Such is why, if you are near to, or entering, retirement, there is a solid argument to be made for rethinking the amount of equity risk currently being undertaken in portfolios.
In the short term, a period of one year or less, political, fundamental, and economic data has very little influence over the market. Such is especially the case in a late-stage bull market advance where the momentum chase has exceeded the grasp of the risk undertaken by investors.
In other words, in the very short term, “price is the only thing that matters.”
Price measures the current “psychology” of the “herd” and is the clearest representation of the behavioral dynamics of the living organism we call “the market.”
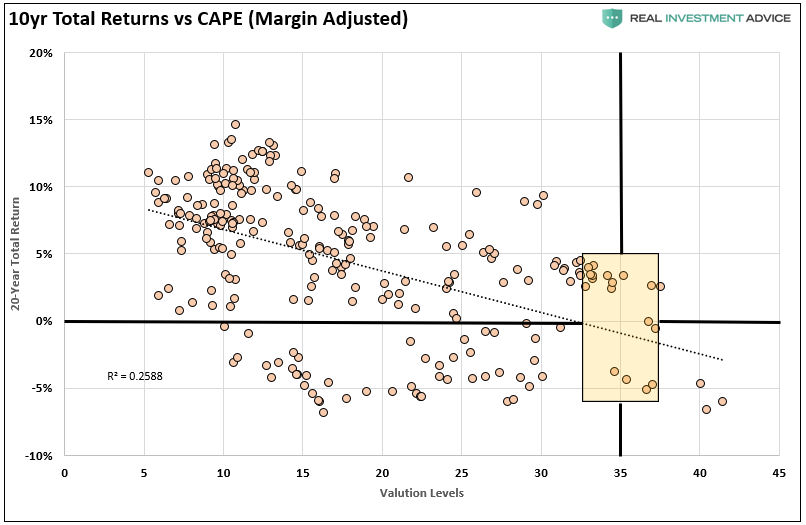
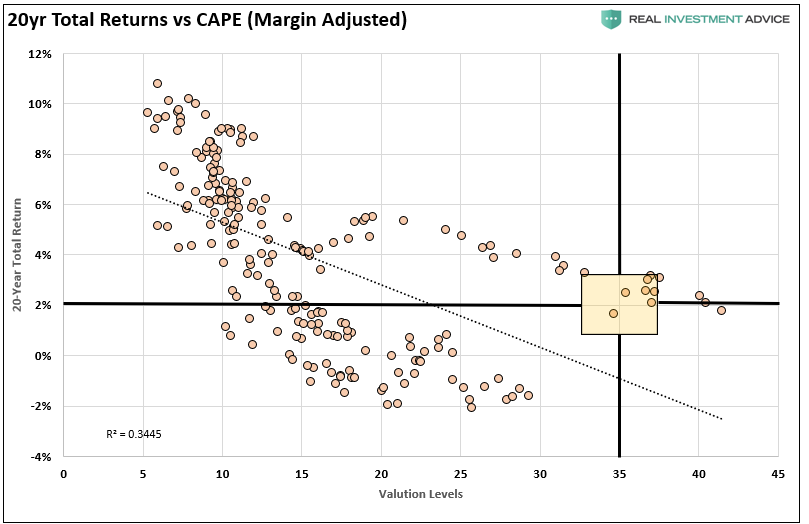
But in the long-term, fundamentals are the only thing that matters. Both charts below compare 10- and 20-year forward total real returns to the margin-adjusted CAPE ratio. Review the two charts above showing the historical 10- and 20-year total returns. Given we are currently pushing the second-highest levels of valuations in market history, the charts below confirm that historical data. Investors should expect very low rates of future returns.
Unfortunately, most investors remain woefully behind their promised financial plans. Given current valuations and the ongoing impact of “emotional decision making,” the outcome is not likely going to improve over the next decade.
Conclusion
For investors, understanding potential returns from any given valuation point are crucial when considering putting their “savings” at risk. Risk is an important concept as it is a function of “loss.” The more risk an investor takes within a portfolio, the greater the destruction of capital will be when reversions occur.
The analysis above reveals the important points that individuals should OF ANY AGE should consider:
- Investors should downwardly adjust expectations for future returns and withdrawal rates due to current valuation levels.
- The potential for front-loaded returns in the future is unlikely.
- Your life expectancy plays a huge role in future outcomes.
- Investors must consider the impact of taxation.
- Investments allocations must carefully consider future inflation expectations.
- Drawdowns from portfolios during declining market environments accelerate the principal bleed. Plans should be made during up years to harbor capital for reduced portfolio withdrawals during adverse market conditions.
- Over the last 11-years, the yield chase and the low rate environment have created a hazardous environment for investors.
- Investors MUST dismiss expectations for compounded annual return rates in place of variable rates of return based on current valuation levels.
In conclusion, chasing an arbitrary index that is 100% invested in the equity market requires you to take on far more risk than you most likely realize. Over the last decade, two massive bear markets have left many individuals further away from retirement than they ever imagined.
Investing for retirement should be done conservatively and cautiously to outpace inflation over time. Trying to beat some random, arbitrary index with nothing in common with your financial goals, objectives, and most importantly, your life span has tended to end badly.
Bear markets matter, and they matter much more than you think.

