Current Position of the Market
SPX: Long-term trend – Has the bear market started?
Intermediate trend– The correction has turned into a short-term debacle which may not be over.
Analysis of the short-term trend is done on a daily basis with the help of hourly charts. It is an important adjunct to the analysis of daily and weekly charts which discusses the course of longer market trends.
Market Overview
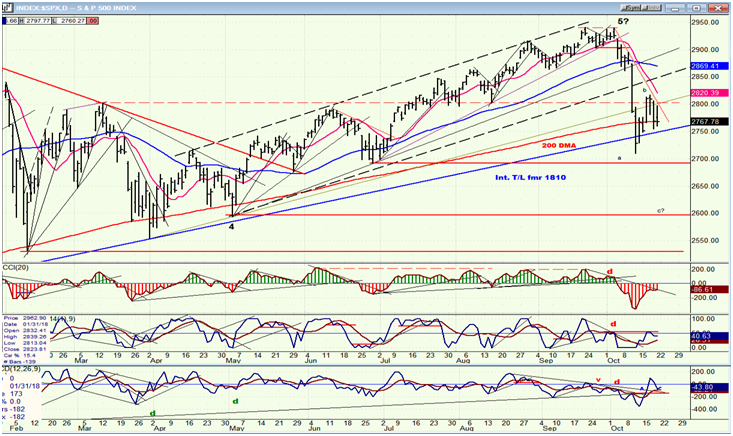
After declining from 2940 to 2711 in its biggest correction since January, SPX rallied to 2817 before reversing and closing the week at 2768 -- all this in the span of three weeks. The question which is on every analyst’s mind is: “Has the bear market started?”
We won’t know the answer for a few more weeks but, to be completely objective, there are two possibilities:1) The drop to 2711 completed an initial phase of the market decline (wave A) and, after a rally in a downtrend to 2817 (wave B), we have already started the next phase of a bear market which should take us all the way down to about 2600 before wave C is complete (but not necessarily the entire bear market). 2) The decline which started from 2817 will be limited to 2740, after which the index will complete the base necessary to take us to a new all-time high before the actual bear market starts.
Both have some merit according to the P&F chart. So, we need to wait and see what happens after we reach 2740. If we hold that level and start a rally which surpasses 2817, the odds are fair that the bull market has not seen its high, yet. However, if we only have a mild rebound and then break below 2740, a resumption of the decline down to 2600 becomes possible. The count taken on the 10X P&F chart at the 2880 level has already given us two potential downside targets: the first to 2670, and the next to 2600 if prices move lower. If the correction continues past 2710, another way to measure its potential extent would be as a measured move. The initial down phase of 230 points would then be replicated starting from 2817, and take the index down to 2587 before completion.
Chart Analysis (The charts that are shown below are courtesy of QCharts)
SPX daily chart
Since most EWT theorists favor the start of a bear market,I have marked the chart accordingly.An alternative to labeling the c-wave equal in length to the a-wave, would be for the c-wave to end at 2675, thus measuring only .618 of the a-wave. If SPX makes a new low over the coming weeks, these are the price levels at which we should be looking for a reversal. This reversal should be the beginning of a powerful rally which could retrace 50% to .618 of the initial decline; in other words assuming that we drop all the way down to 2600, we could get a counter trend rally of 170 to 210 points.
This is looking a little into the future but, for those who did not get out at the top (probably few did because of the sudden drop before reaching the ideal high)this would afford them a second chance to exit their positions before a more lengthy and deeper correction begins. Of course, the first course of action is to wait and see what happens after the index reaches 2740, in case possibility 2), mentioned above becomes viable.
Last week, I mentioned that in order to even have the possibility of making a new high, the index would have to build a base capable of supporting such a move. If the current decline from 2817 stops at about 2740 and some evidence of strong buying returns, a base will have been completed with enough of a count to take us to/near the 3000 level.
As of Friday’s close, the weekly indicators of the four indexes I follow had given a confirmed sell signal, except for DJIA which had only given a preliminary signal. In addition, only IWM had closed below its major trend line drawn from the January 2016 low while the other three had not. At the daily level, all have given sell signals but, with the rally from the low, they have all turned neutral while remaining negative. The A/D indicator briefly poked above the zero line but returned to the negative side by week’s end. If it becomes positive again, it will be a warning that we could get another rally.
SPX hourly chart
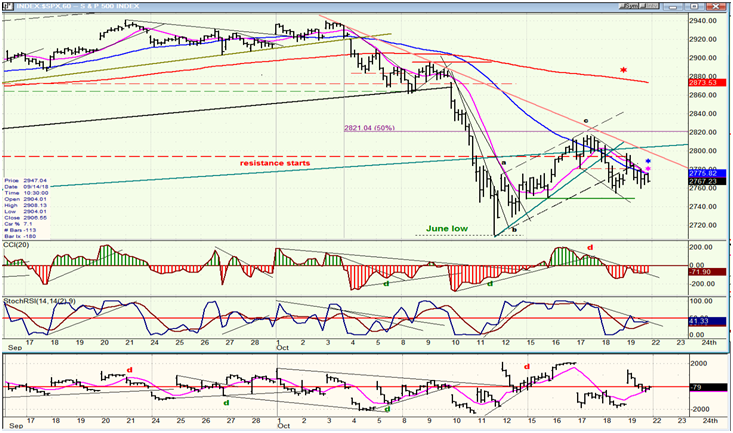
The hourly chart shows that the index rallied from 2711 to 2817, retracing almost 50% of its decline from the 2941 top,and stopping just short of the light red downtrend line before turning down again. It briefly went past the blue 50-dma but turned down again. The MAis in such a pronounced downtrend that it would take several reversal attempts by the index before it could remain above and start to rally. In any case, the current decline from 2817 has a projection to 2740, and that price target will have to be reached before an attempt at reversing can take place. We will then be able to see if there is a substantial change in the market mood, or if the index just holds for a little while and continues to move lower toward the deeper targets (2675-2600).
As of now, the indicators show some deceleration but do not yet display real positive divergence, so we are not quite ready to turn up; but if, by the time we get to the 2740 target, we have created some divergence, we should be ready for a rebound. Based on the strength of that rebound, we should be able to determine whether or not we have truly started a bear market.
DJIA, SPX, NDX,IWM (daily)
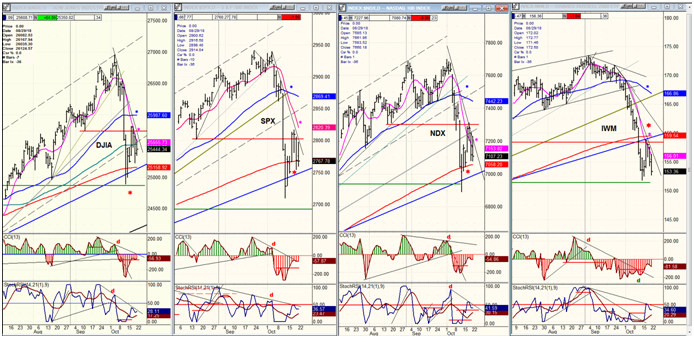
The order of relatinve strength has not changed. DJIA continues to be the strongest index and IWM the weakest. In spite of Friday’s weakness, DJIA managed to remain positive, while IWM made a new closing low in its downtrend. This does not exactly indicate that we are about to have a strong reversal. What it does suggest, is that all indices are about to retest their lows with IWM probably making a new low. As long as this relative relationship exists between IWM and the other three, there is not much of a chance that the decline is over.
PowerShares DB US Dollar Bullish (NYSE:UUP) (dollar ETF) daily
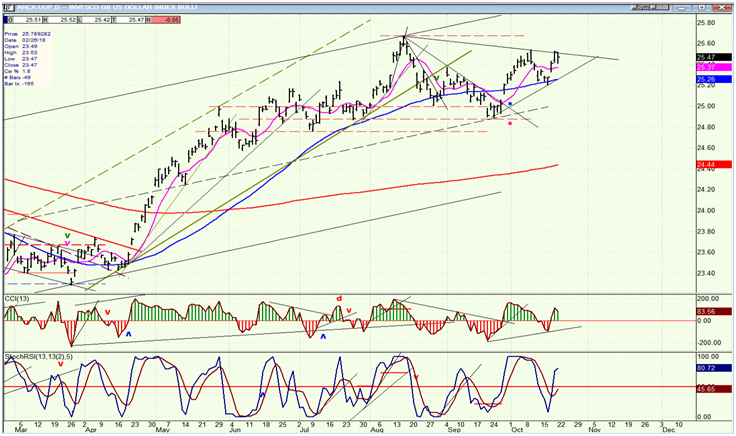
UUP does not look ready to roll over and start a downtrend -- or even a correction. It actually seems more ready to continue its uptrend, and this may be what the indicators are telling us. But let’s give it a little more time to clarify its intention. If it moves above the trend line, it will look even more likely to make a new high.
The base recently formed on the P&F chart gives it the potential to challenge the former high of 26.50(first achieved in March 2015) and slightly exceeded in December 2016. Its all time high was made in November 2008 at 27.19, but the base created between 2011 and 2015 gives it the potential of reaching about 28.00.So, until price weakness begins to become manifest, it’s very possible that this is where it is heading. The daily indicators appear to have just given another buy signal, and a little more strength could turn the weekly indicators into a buy signal as well.
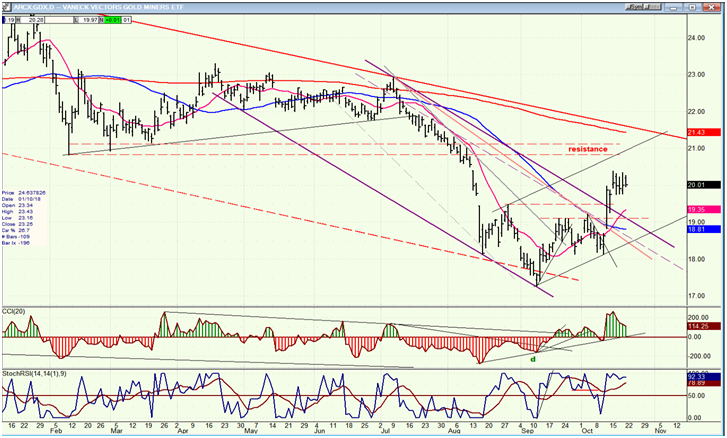
GDX (NYSE:GDX) (Gold miners ETF) daily
After making its September low of 17.43, GDX broke out of short-term and intermediate channels, but does not look capable of moving out of its long-term channel. Strong resistance starts at about 21 and,slightly above, it would encounter its long-term trend line which if buffered by the 200-dma. The final nail in the proverbial coffin is the fact that 21.00-21.50 looks like the full extent of the count it can derive from the narrow P&F base that it has been able to build since its low of 17.43. Additionally, the seemingly ongoing strength shown by UUP is not a good omen for GDX to exceed about 21.00.
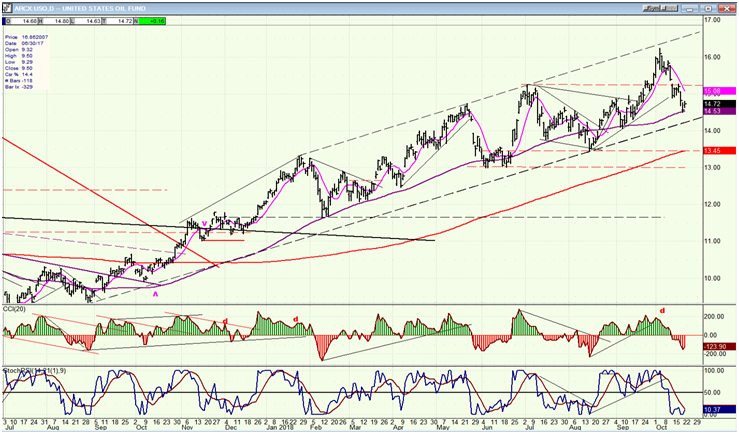
USO (United States Oil Fund (NYSE:USO)) Daily
USO may have reached the extent of its base count. I was stretching its potential a little higher, because it looked as if it had the possibility of one more wave on the upside. But the current retracement down to 14.50 looks as if a correction of the entire trend from 8.65 has started. After all, it has nearly doubled its price without much of a correction. If it should continue below the dashed line, it could drop to the red 200-dma before finding support.
Summary
We should soon find out if we are already in a bear market, or if there is going to be one more rally to 3000 before one starts. I have outlined two possibilities above, and the bullish onewill be eliminated if we make a new low. I have also discussed what we can expect in terms of projections and market action over the next several weeks in case we have, in fact, started a bear market.
