
Analysis for Bitcoin Cash to BTC. Updated scenario to trade BCH amid the rising Bitcoin. Targets and key levels to trade BCH/BTCIn this post, I applied the following tools: fundamental analysis, all-round market view, market balance level, oscillators, volume profile, graphic analysis, trendline analysis, key levels, Kagi and Tic-Tac-Toe charts.
Dear friends,
Today, I’d like to dwell upon the price of Bitcoin Cash to Bitcoin. I analyzed the pair in July last time, which is a very long period.
Today, I’ll offer you BTC fundamental analysis and trading scenario for BCH/BTC pair.
As the last forecast was suggested 3 months ago, it makes no sense to take it into consideration now. I’ll do it again.
Bitcoin Cash fundamental analysis
Fundamentally, the main driver for BCH trend, in addition to the genreal cryptocurrency market effects, is now can be suggested the information about a possible hardfork that is planned for November 15,2018, that is, just in a month.
In the recent times, any network integration is called a hardfork; but, in fact, it is when newtork protocol is upgraded, if the consensus is not reached, and a part of miners doesn’t support the innovations, then there will form to branches that are not compatible with each each other. One is the upgraded protocol, another is the old one, without any changes. It finally results in the developing of a new altcoin that has its own name.
So, on November, 15, there can be a real Bitcoin Cash hardfork, with a division
The planned pack of updates is called OP_CHECKDATASIG.
The new opcode of Bitcoin Cash is designed to:
- improve the BCH scripting language;
- to validate arbitrary messages from outside the blockchain;
- to introduce set transaction distribution.
This updated version is not supported by the head of the one of the largest mining pools, Coingeek, Calvin Ayre.
As it is clear from the chart above, the Bitcoin Cash community is rather big. Coingeek will hardly be as single one, it is likely to be supported by other, smaller pools that are tired of Roger Ver selfishness and the low quality.
These arguments are held amid the scandal with the discovered hidden bug that could have block the entire BCH network. Remember, that the critical vulnerability appeared just during one of the network last updates.
BCH/BTC technical analysis
In the BCH monthly chart above, it is clear that the BCH/BTC ticker has hit the support line, the low of December, 2017. Besides, you see that BCH went below the market point of control.
In general, the situation looks rather bearish. There seem to be no BCH buyers. The market is drawn down under its own weight and is really at the edge.
In the weekly BCH/BTC price chart, you see that both RSI stochastic and MACD are trying exit the oversold zone; however, it is often like this, when the ticker is at the support levels and the trend is changing to the sideways trend. So, these signals shouldn’t be seriously taken into account.
Nevertheless, the ticker is below Keltner channel, and the BCH price return to the central line at 0.093 BTC would be quite natural and unexpected.
In the Bitcoin Cash daily chart above, there is a clear series of bullish divergences. Their growth hasn’t yet worked out; as there are no opposite, bearish divergence, the bullish ones might be considered active.
The price chart doesn’t suggest any growth signs. There are no candlestick pattern, indicating it. Oscillators are also bearish, suggesting the BCH price may go deeper.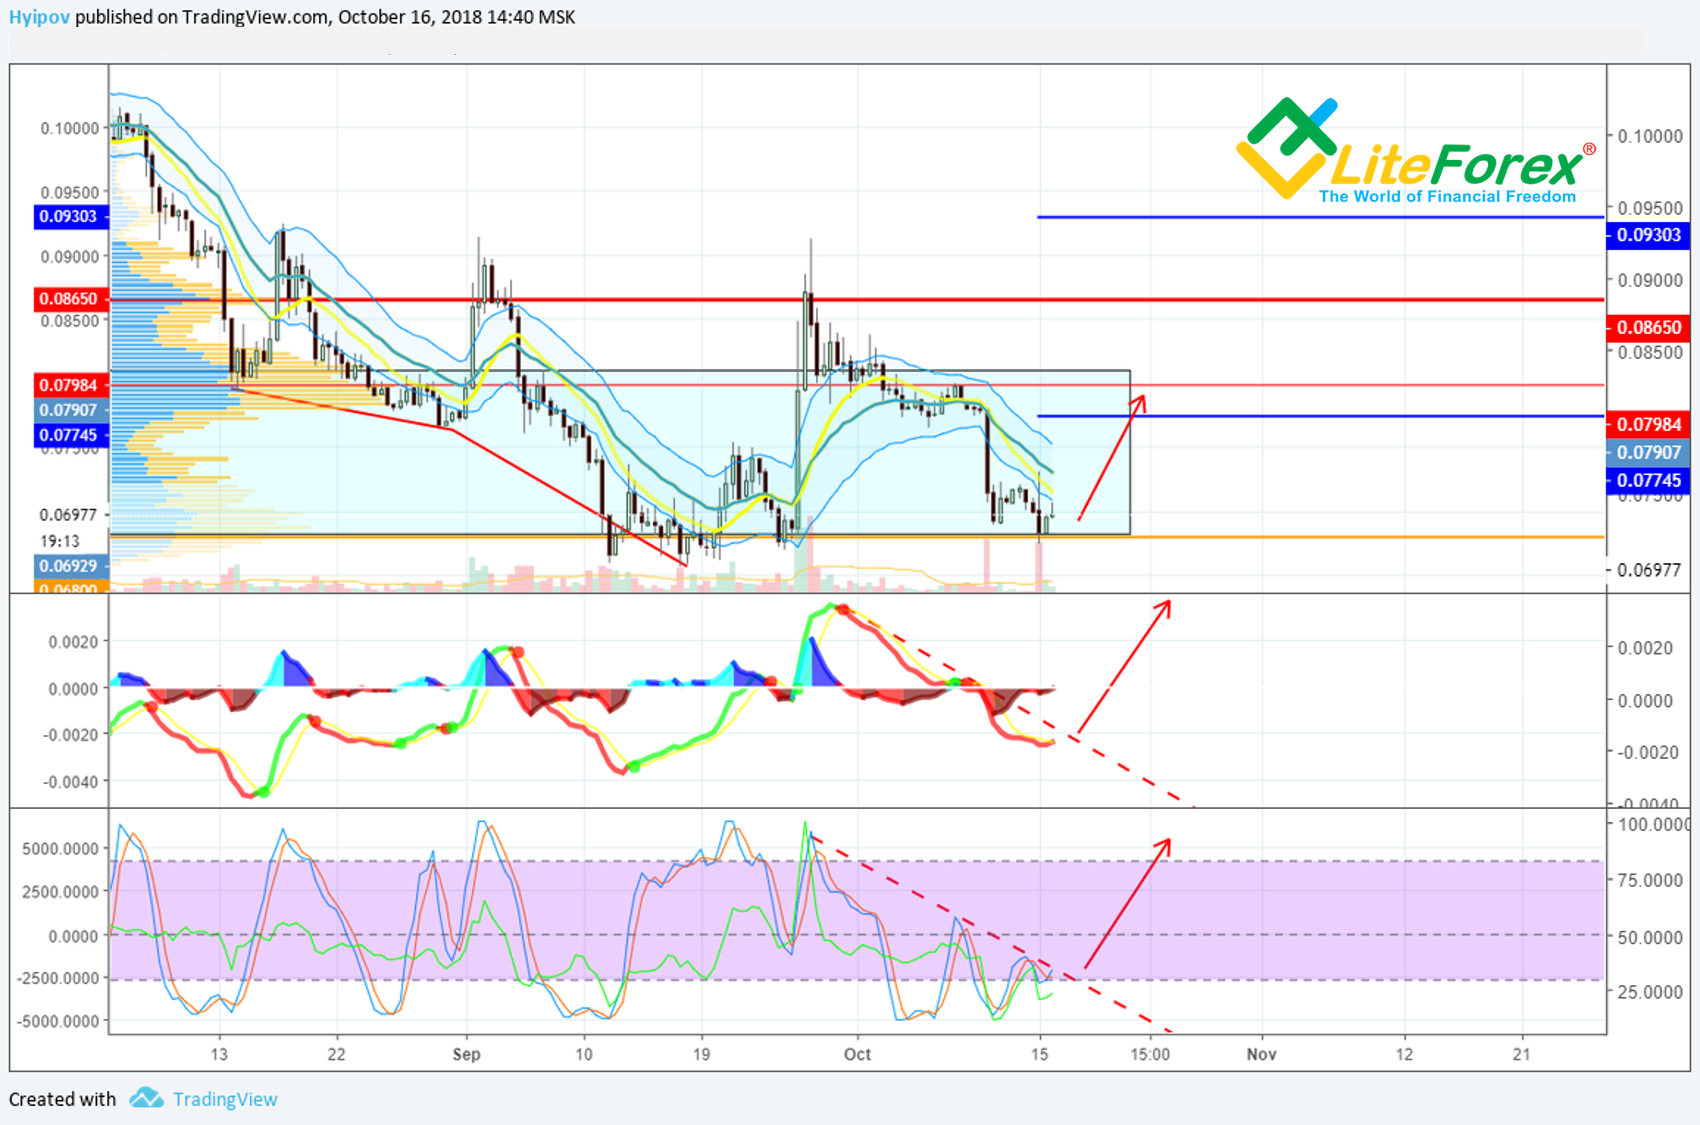
It is clear from BCH/BTC 12H chart above that oscillators look like springs. This pattern usually completes with a spike, which can look like a price momentum in the chart. In the current situation, there will hardly be a strong momentum, the price will hardly go higher than 0.079 BTC.
The 12H timeframe in the Tic-Tac-Toe chart has quite clearly outlined the channel’s borders, suggesting that a rising triangle should emerge with the top border at 0.091 BTC.
In the 12-hour Kagi chart, you see a support level at about 0.067. The growth signal will appear when the nearest shoulder level is broken out, it is at 0.071 BTC. Next, there will be resistances for the BCH/BTC ticker at 0.079 BTC /0.083 BTC /0.087 BTC.
Final BCH/BTC trading scenario
Summing up all the above, I suggest that the BCH/BTC market is bearish. There is the consolidation in the bearish trend, and the ticker is at the channel’s lower border. Because of the BCH is strongly oversold and supported by buyers at the levels below 0.069 BTC (I marked the buyer interest with the red circles). The most likely scenario is local bullish correction. The scenario will be proved id the BCH price is consolidated above 0.071 BTC.
Growth target is the price zone of 0.087 BTC– 0.090 BTC.
I suggest the trade to be of low risk, as you can put stop loss relatively close, below level 0.065 BTC. However, amid the strong volatility in the market, you must be prepared for any final; there for you must be extremely careful to follow risk management rules and not to risk more than 1% of your deposit.