XLE (N:XLE), the energy sector ETF, has multiple Bat harmonic patterns fueling both the Day and Intraday charts.
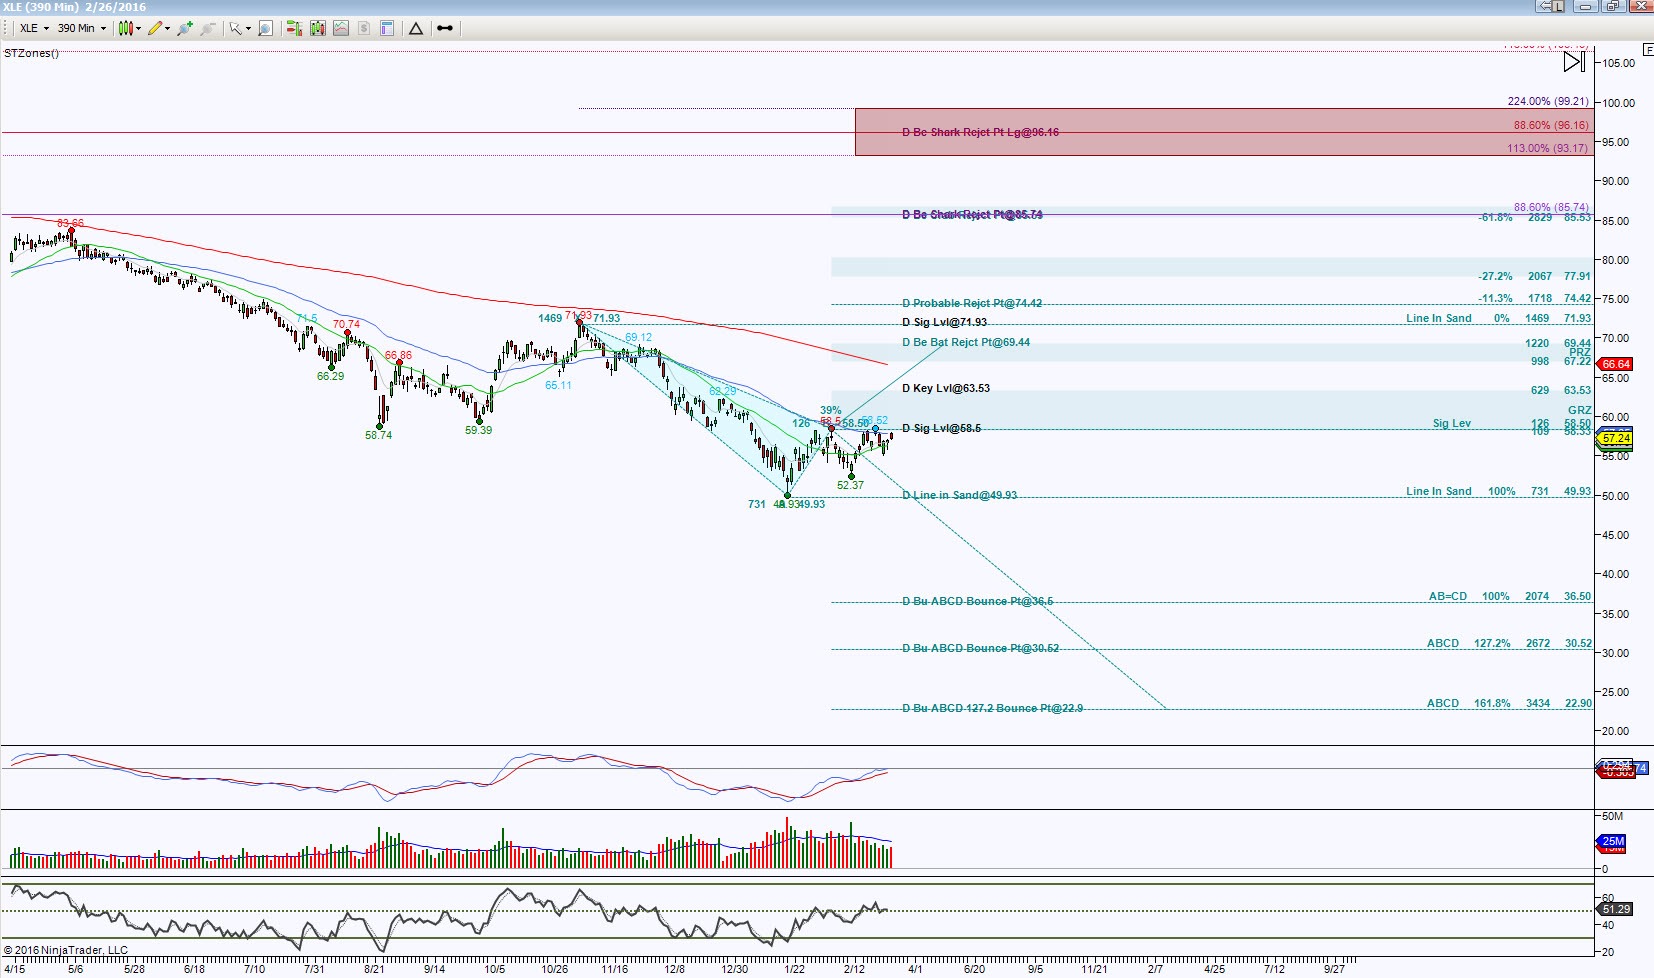
The Day chart shows a cyan colored emerging Bat, which its completion requires price to take out and push off 58.50 for starters.

There is some pull to upside, the question is if there’s enough to initially hold above 58.50 then more important have conviction with upside continuation to the target of 69.44. The cyan levels are scaling points. Now there are higher targets should this particular Bat fail to retrace. One of the great things about harmonic patterns is their completion offers buyers and sellers an opportunity to step in, in this case a test of 69.44 offers sellers to step in to retrace the pattern. This does not mean it’s a guarantee, for there are no guarantees in trading, but does offer probability and opportunity. So back to this Bat scenario, should price have upside continuation above 69.44 then more important 71.93, the ideal target is 85.60 region, a double bearish PRZ. This means there are two harmonic pattern completion targets that merge into one zone of potential reversal.
Since there’s some consolidation action under 58.50, the other side of the coin, is if price holds below 58.50, the bias is neutral with a downside pull and the implication is an attempt to retest 49.93. Should buyers fail to step in and keep price above there, then downside continuation targets are the noted ABCD levels.
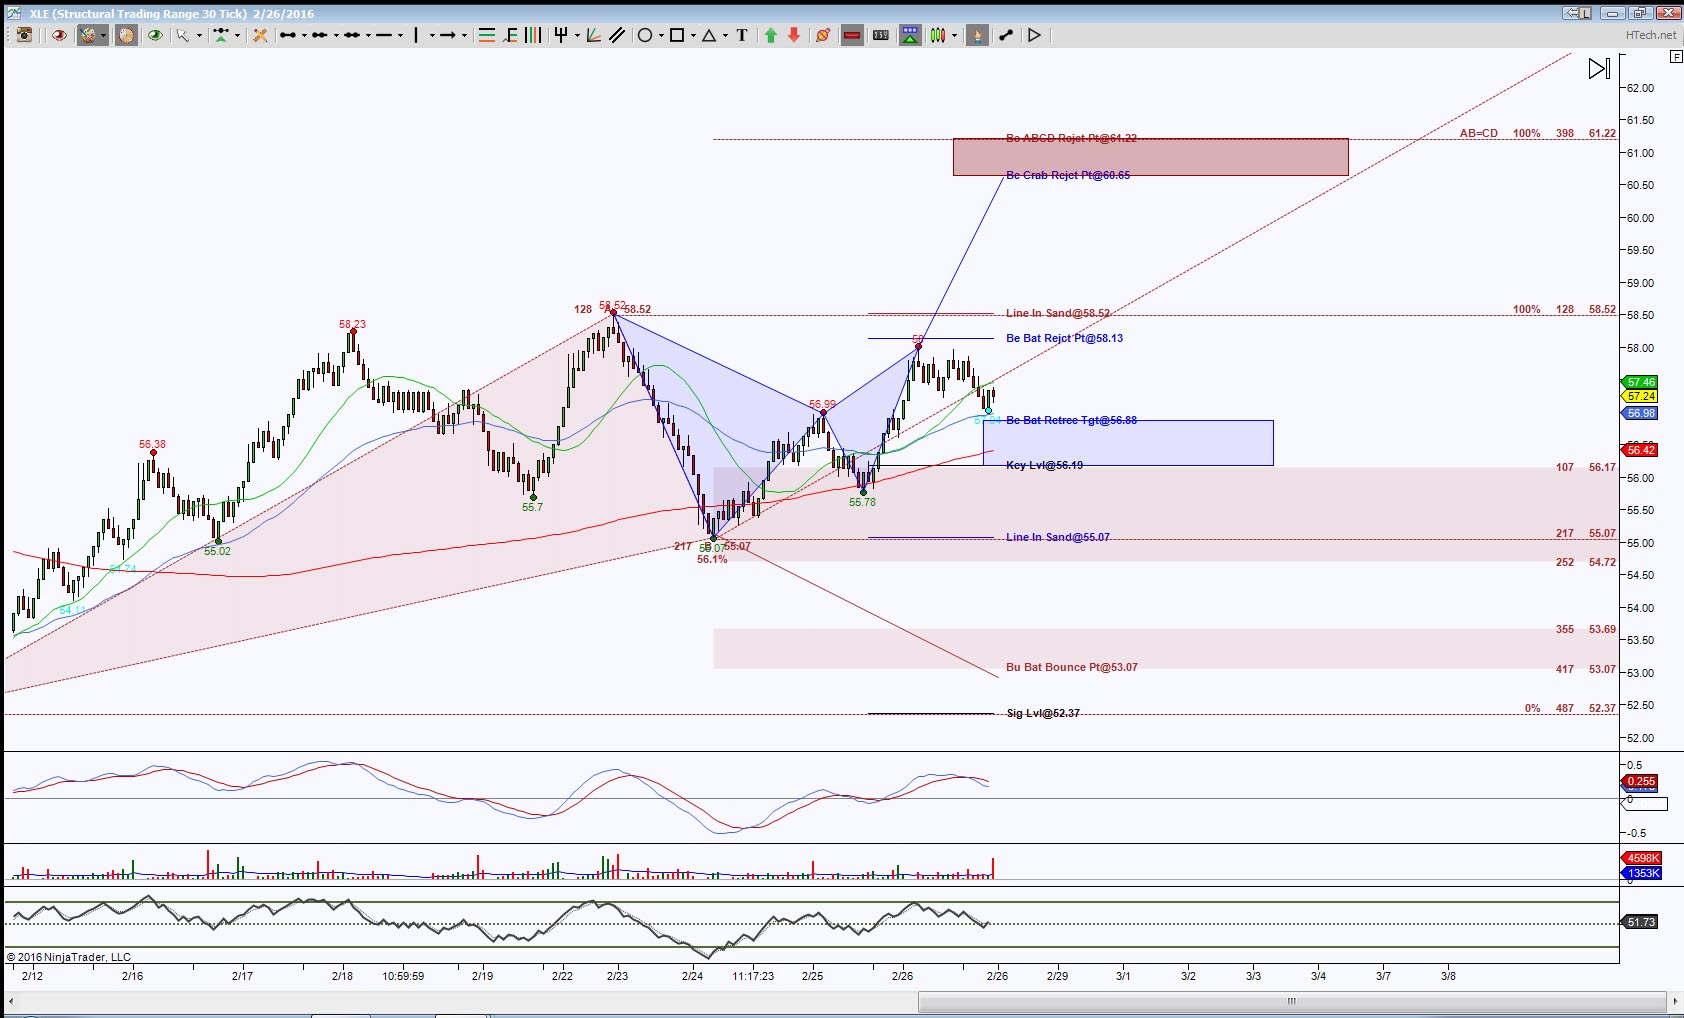
To hone in on that consolidation, I’m using a 30 bar STRange chart for an intraday perspective.

This chart shows a blue Bearish Bat is in retracement mode, it’s ideal minimum target is 56.88 and ideal target is 55.07. This is key whether the initial retrace target holds price up or not. A bounce there represents a shallow retracement and suggests another go at taking out the 58.52. If buyers can do that, there’s a magnet created from another double PRZ between 60.65 and 61.22. What this scenario does is help price get above that 58.50 Significant Level on the Day chart.
Each colored zone represents an area of decision once inside them, because which way price breaks out of the zone offers insight to directional bias. A hold below 56.88 has the initial support test target at 56.19, this is another important region, note it is a double zone line. There is another Bat, the larger brown colored pattern. If the blue Bat retraces its ideal 100% at 65.07, this will help that brown Bat have higher probability of playing out.
The intraday chart does show price in sideways range (the consolidation of Day chart) so once price can hold beyond one of the Line in Sand levels, 58.52 or 55.07, then there’s the initial clues as to how the Day chart will play out in regards to that 58.50 level.
Trading involves substantial risk and is not suitable for all investors. Past performance is not indicative of future results.
