The Bullion Bank trading desks, which are routinely short thousands of metric tonnes of digital silver, are once again attempting to keep price below the 200-day moving average.
And why is this so important to The Banks? For the most basic reasons of all...greed and profit.
The only data available to measure the size of the Bank net short position in Comex silver comes from the corrupt and compromised CFTC. Though it seems useless to use CFTC-generated data, unfortunately we have no other choice. To that end, as of the most recent reporting, we find Bank positions as follows:
• As measured by the latest Commitment of Traders Report, the NET position of the "commercials" in Comex silver is 80,436 contracts short. As measured by the latest Bank Participation Report, the NET position of the 24 Banks involved in Comex silver is 69,473 contracts short. For the sake of simplicity, let's just use the smaller BPR number and round it up t0 70,000 contracts NET SHORT for The Banks that trade on the Comex.
At 5,000 ounces of digital silver per Comex contract, 70,000 contracts is a net short position of 350,000,000 ounces or about 40% of total 2017 global mine supply. (It's also about 150% of the total amount of silver allegedly held in the Comex vaults but we'll save that topic for another day.)
For the purpose of this discussion, let's just look at that 350,000,000 ounce NET short position. Consider the size of that position and then do the simple math of realizing that a $1 move in either direction means a $350MM trading gain or trading loss for these Bank desks.
Now, getting back to the title of this post and The Banks desire to keep price below the 200-day moving average. Why is this so important to them? Again, it's greed and profit.
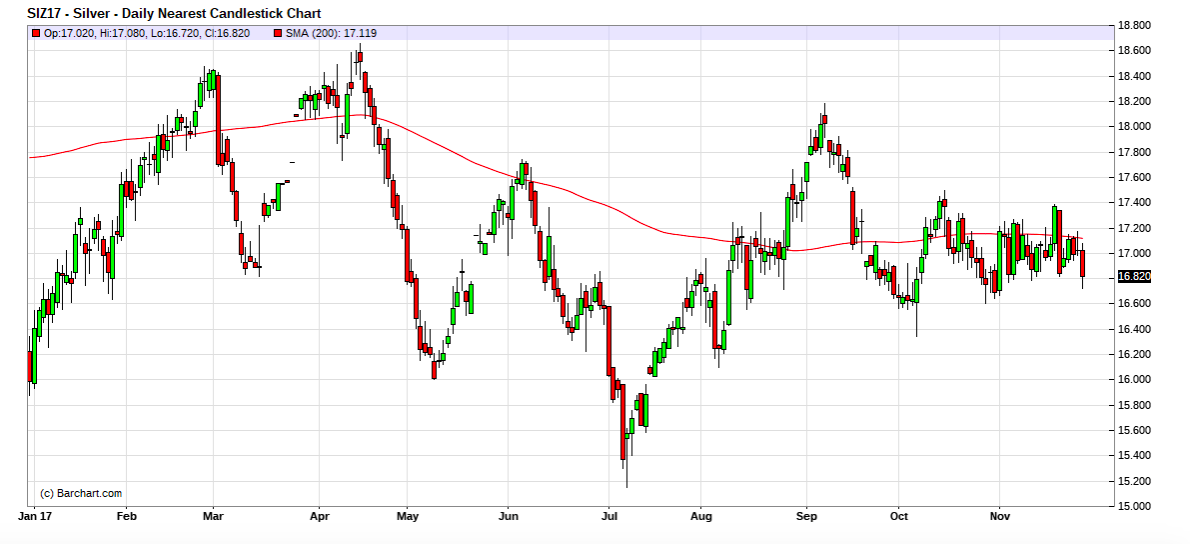
As you can see below, on just three previous occasions in 2017, price has been able to briefly move above the critical 200-day MA. In February, the subsequent rally in price was about 60¢. In April, the move was nearly identical but in August, price moved over $1 in two weeks once the 200-day was breached.

So why defend the 200-day again now? First and foremost, The Banks (because of their massive NET short position) do NOT want a rally into year end that might prompt even more interest and speculator buying into 2018. More important though is the simple greed factor as another $1 move up in price would be a $350MM paper loss against their net short position!
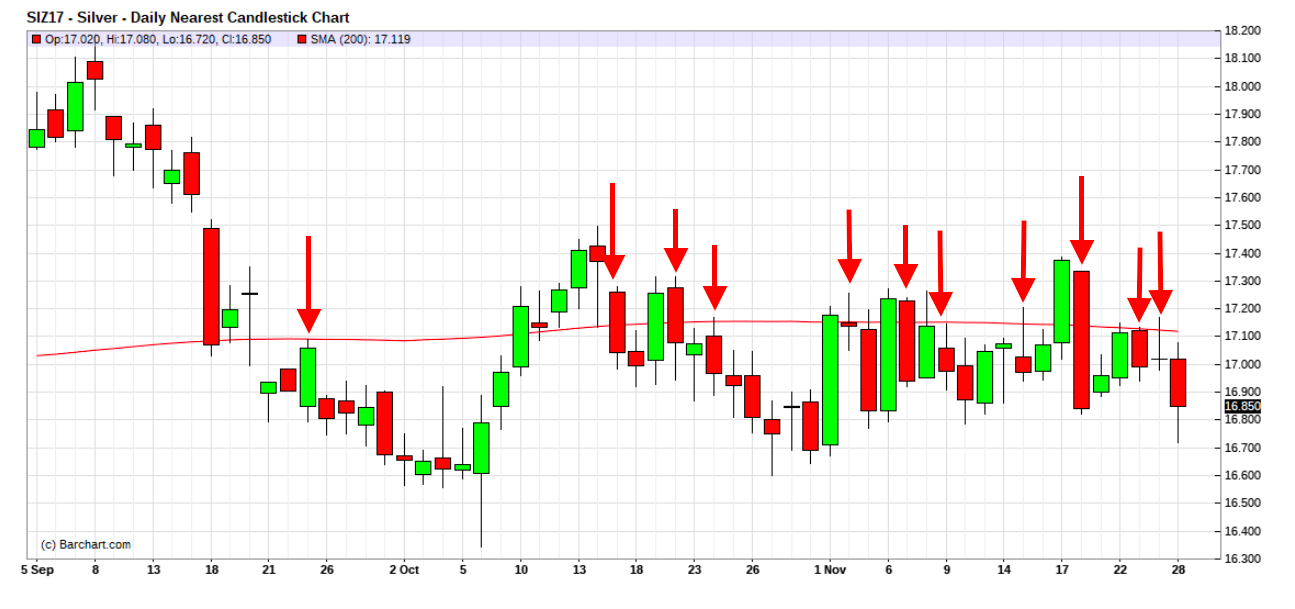
Though the chart above clearly betrays The Banks collusive and manipulative trading pattern for 2017, the chart below really brings it into focus in the present. Note the capping since price was broken below the 200-day on September 21. We've drawn ELEVEN arrows on this chart to point you to clear instances of Bank intervention to rig price back below the 200-day MA. Note, too, how frequently a one day close above the 200-day is met with a massive red candle the next.

So, for now, the point of this is simple. While we expect US dollar weakness to prompt a decent year for silver and all metals and commodities in 2018, until Comex silver can break free of the Bank shackles at the 200-day moving average, price will remain stuck in neutral. This will have an impact on mining share prices, too, so anyone interested in the sector should be sure to watch silver's 200-day moving average all through the month of December.
