📈 Will you get serious about investing in 2025? Take the first step with 50% off InvestingProClaim Offer

Banking Stocks Inches Away From 2017 Lows, Facing Breakdown Risk

Published 05/18/2017, 12:37 AM
Updated 07/09/2023, 06:31 AM
XAU/USD
-
GC
-
KBE
-
DXY
-

Banking stocks fell sharply today. The bank ETF SPDR S&P Bank (NYSE:KBE) went 3.97 pct lower, which is significant for the sector. With that, banking stocks are near their 2017 lows. They will break down if they move lower from here.

“Some stocks had their biggest intraday declines since last year’s Brexit vote,” observes Bloomberg analyst Gillian Tan.

The writer on Bloomberg is positive on banking stocks, saying that “banks remain on a path to improving profitability. That’s tied to an assumption that their interest income will rise as interest rates climb, however slowly.”

Now that is the key point: the correlation with interest rates.

InvestingHaven’s view on markets is based on intermarket dynamics, which is about the effect of one market on one or several other markets. Today’s plunge in banking stocks really did not come out of the blue, nor was it the so-called “Trump effect” that suddenly stopped to work. It was the effect of falling interest rates on other markets, primarily banking stocks and other financials. Because of that, the dollar weakened and gold went higher.

That is how markets work. Interest rates were leading and created intermarket effects.

A closer look at the banking sector, represented by the KBE ETF on below chart, shows that the sector has arrived at a critical juncture. KBE is testing its 2017 lows, and it is the 3d test of the same price level (41 points).

If prices go lower from here, we tend to call this a breakdown. If that occurs, it would have very negative implications on banking stocks in 2017. It would suggest that the banking sector will fall to 35 points where it will take a first pause.

Note how today’s fall came with rising volume, which is a bearish sign.

Investors keep a very close eye on the 41 points level in KBE which is the breakdown level.
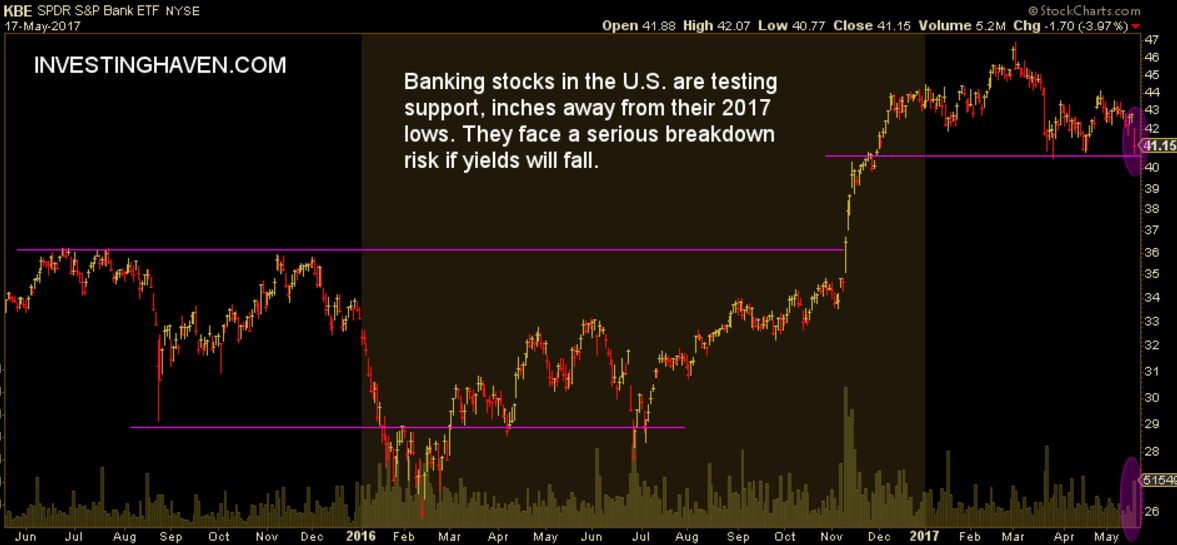
KBE Chart

Original post

Latest comments

Loading next article…
Risk Disclosure: Trading in financial instruments and/or cryptocurrencies involves high risks including the risk of losing some, or all, of your investment amount, and may not be suitable for all investors. Prices of cryptocurrencies are extremely volatile and may be affected by external factors such as financial, regulatory or political events. Trading on margin increases the financial risks.
Before deciding to trade in financial instrument or cryptocurrencies you should be fully informed of the risks and costs associated with trading the financial markets, carefully consider your investment objectives, level of experience, and risk appetite, and seek professional advice where needed.
Fusion Media would like to remind you that the data contained in this website is not necessarily real-time nor accurate. The data and prices on the website are not necessarily provided by any market or exchange, but may be provided by market makers, and so prices may not be accurate and may differ from the actual price at any given market, meaning prices are indicative and not appropriate for trading purposes. Fusion Media and any provider of the data contained in this website will not accept liability for any loss or damage as a result of your trading, or your reliance on the information contained within this website.
It is prohibited to use, store, reproduce, display, modify, transmit or distribute the data contained in this website without the explicit prior written permission of Fusion Media and/or the data provider. All intellectual property rights are reserved by the providers and/or the exchange providing the data contained in this website.
Fusion Media may be compensated by the advertisers that appear on the website, based on your interaction with the advertisements or advertisers.
© 2007-2025 - Fusion Media Limited. All Rights Reserved.