Bank of England: First “Super Thursday” of the year Today, the BoE simultaneously releases its monetary policy decision, the meeting minutes and its quarterly Inflation Report. No change in policy is expected at the meeting, while consensus is that the vote will once again be split 8-1 with the lone dissenter, Ian McCafferty to maintain his call for a rate hike. Therefore, the focus will be on the tone of the meeting minutes, the updated economic projections of the Inflation Report, and on any comments from Gov. Carney’s press conference. A lot has changed since the BoE published its November inflation Report and the degree to which the new projections will be changed are likely to determine sterling’s reaction. We expect the Bank to revise down its near-term GDP growth and inflation forecasts. Officials could state that inflation will edge up slower than previously expected due to the continuous slump in oil prices. On the other hand, given that the labour market has continued tightening faster than expected, we see downside revisions in the unemployment rate forecasts. However, following Gov. Carney’s remarks that now is not the time to raise rates, we believe that an improving labor market would not be enough to persuade the Bank to press the hike button any time soon. The slowdown in China, the continuous collapse in oil prices as well as the moderate domestic wages and GDP growth are enough reasons for the Bank to be patient. But we still maintain the view that perhaps the biggest obstacle for the BoE is the uncertainty surrounding the forthcoming “Brexit” referendum. Therefore, we will be also looking for any hints or comments on how this pre-referendum environment has been affecting the British economy and as a consequence, the Bank’s policy-setting framework. Overall, evidence of a dovish rhetoric could diminish market expectations for any rate hikes in 2016 and may put the pound under renewed selling pressure.
• Fed’s Dudley pushes hike expectations further back Yesterday, New York Fed President William Dudley stated that financial conditions have tightened considerably since the FOMC raised interest rates. If this situation continues until March, policy makers would have to take that into consideration when deciding on interest rates. He also added that any further strengthening of the dollar could have serious consequences for the health of the US economy. Echoing Vice-Chair Fischer’s recent comments that the slowing global economy could impact growth and inflation in the US, Dudley’s remarks pushed further back market expectations for the second hike to come in March. Investors currently assign a 10% probability for a hike at the next Fed meeting. His comments also served as a catalyst for a major sell-off in USD, which weakened significantly across the board.
• Besides BoE: Today, we get data only from the US. The preliminary Unit Labour Costs Index for Q4 is forecast to have accelerated from the previous quarter. Usually this indicator is not a major market mover. However given the Fed’s emphasis on the labor market and just one day ahead of the US employment report, it might attract some attention. Initial jobless claims for the week that ended January 28th are expected to have increased, which would increase the 4-week moving average somewhat as well. Factory orders are forecast to have fallen in December at a faster rate than the previous month. This would be the 5th consecutive month of a fall in the figure and given the recent softness in industrial indicators and surveys, this could prove USD-negative.
• We have three speakers scheduled on Thursday: BoE Governor Mark Carney, ECB President Mario Draghi and ECB Executive Board member Yves Mersch.
The Market
EUR/USD skyrockets and hits 1.1145
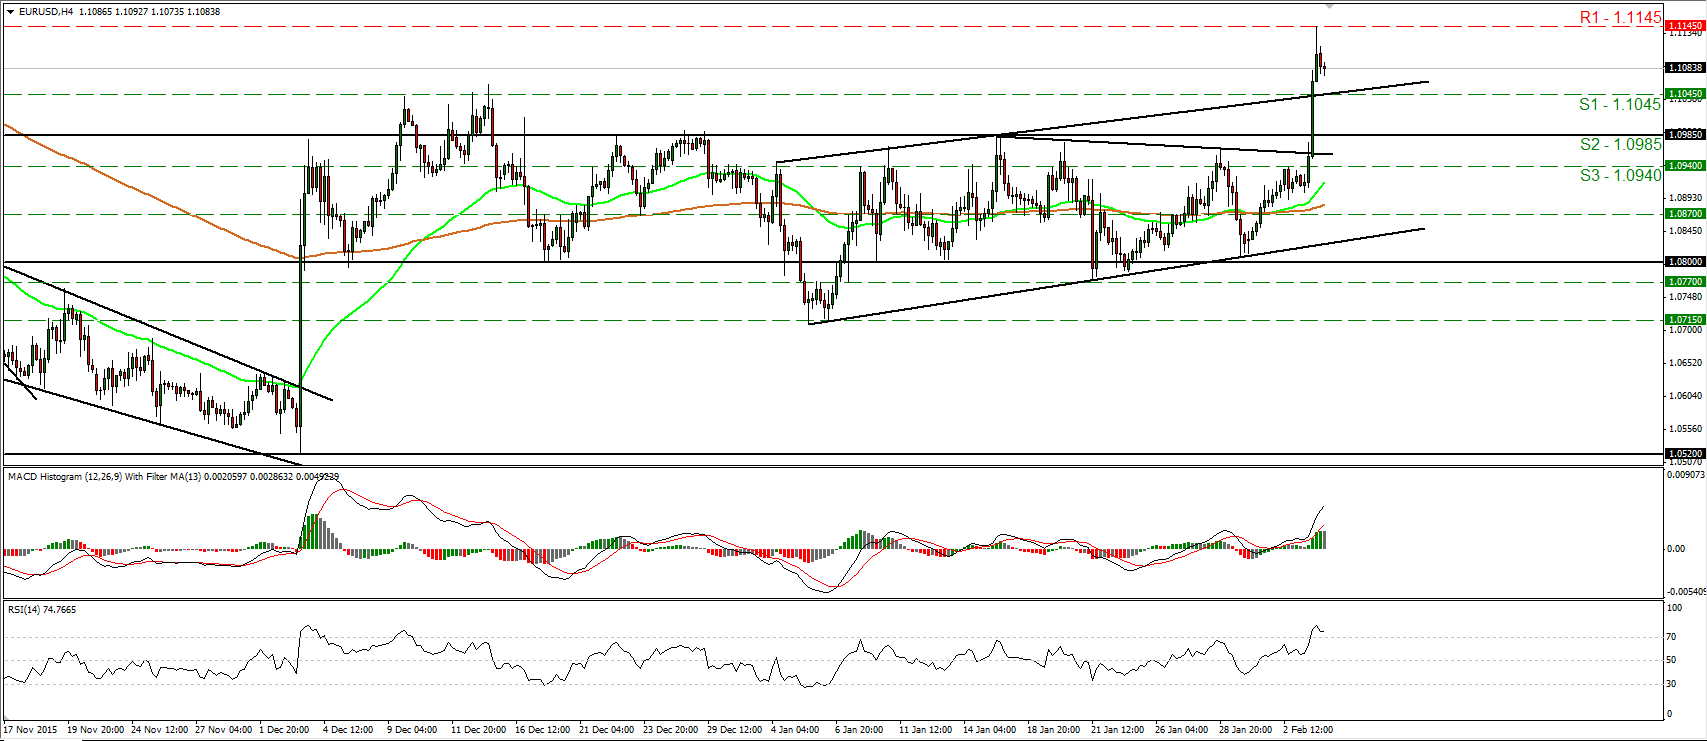
• EUR/USD rocketed higher on Wednesday after New York Fed President William Dudley said that the significant global downturn and additional dollar strength could hurt the US. The pair emerged above the 1.0985 (S2) hurdle, the upper bound of the sideways range it had been trading recently, and hit resistance at 1.1145 (R1). The rally has turned the short-term outlook to the upside in my view and therefore, I would expect a clear move above 1.1145 (R1) to open the way for the 1.1200 (R2) area. However, given that the rally was overextended and taking a look at our short-term oscillators, I see the possibility for a corrective setback before the bulls decide to pull the trigger again. The RSI has topped within its overbought territory and could fall below 70 soon, while the MACD, although positive, shows signs that it could start topping. As for the bigger picture, although we may see the pair trading higher in the short-run, as long as it is trading between the 1.0800 key zone and the psychological area of 1.1500, I would consider the medium-term outlook to stay flat.
• Support: 1.1045 (S1), 1.0985 (S2), 1.0940 (S3)
• Resistance: 1.1145 (R1), 1.1200 (R2), 1.1280 (R3)
GBP/JPY waits for the BoE
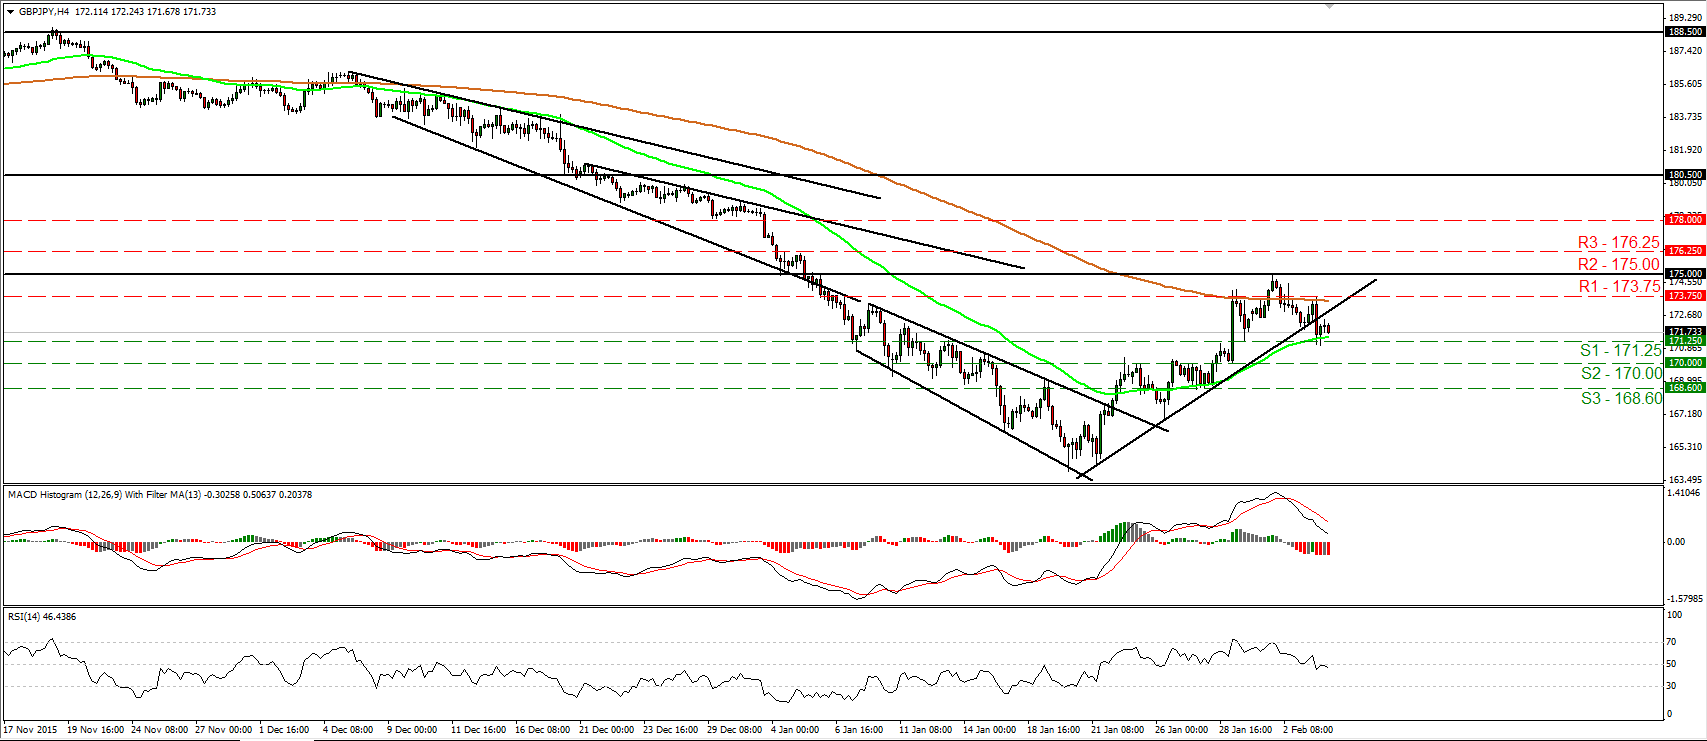
• GBP/JPY traded lower on Wednesday, falling below the short-term uptrend line taken from the low of the 21st of January. Today is another “Super Thursday” in the UK as the BoE simultaneously releases its monetary policy decision, the meeting minutes and its quarterly Inflation Report. We expect the Bank to revise down its near-term projections in the Inflation Report and the meeting minutes to show a more dovish rhetoric than previously. This could hurt the pound and cause GBP/JPY to tumble below the support of 171.25 (S1). Something like that could initially aim for the psychological zone of 170.00 (S2) and then to target the 168.60 (S3) line. Our short-term oscillators detect downside speed and corroborate my view for further declines. The RSI slid below its 50 line and is now pointing down, while the MACD, although positive, stands below its trigger line, and points south as well. Switching to the daily chart, the decline following the test at 175.00 (R2) is probably an early sign that the recovery started on the 20th of January is a corrective move of the longer-term negative path.
• Support: 171.25 (S1), 170.00 (S2), 168.60 (S3)
• Resistance: 173.75 (R1), 175.00 (R2), 176.25 (R3)
NZD/USD escapes from the upper bound of a triangle
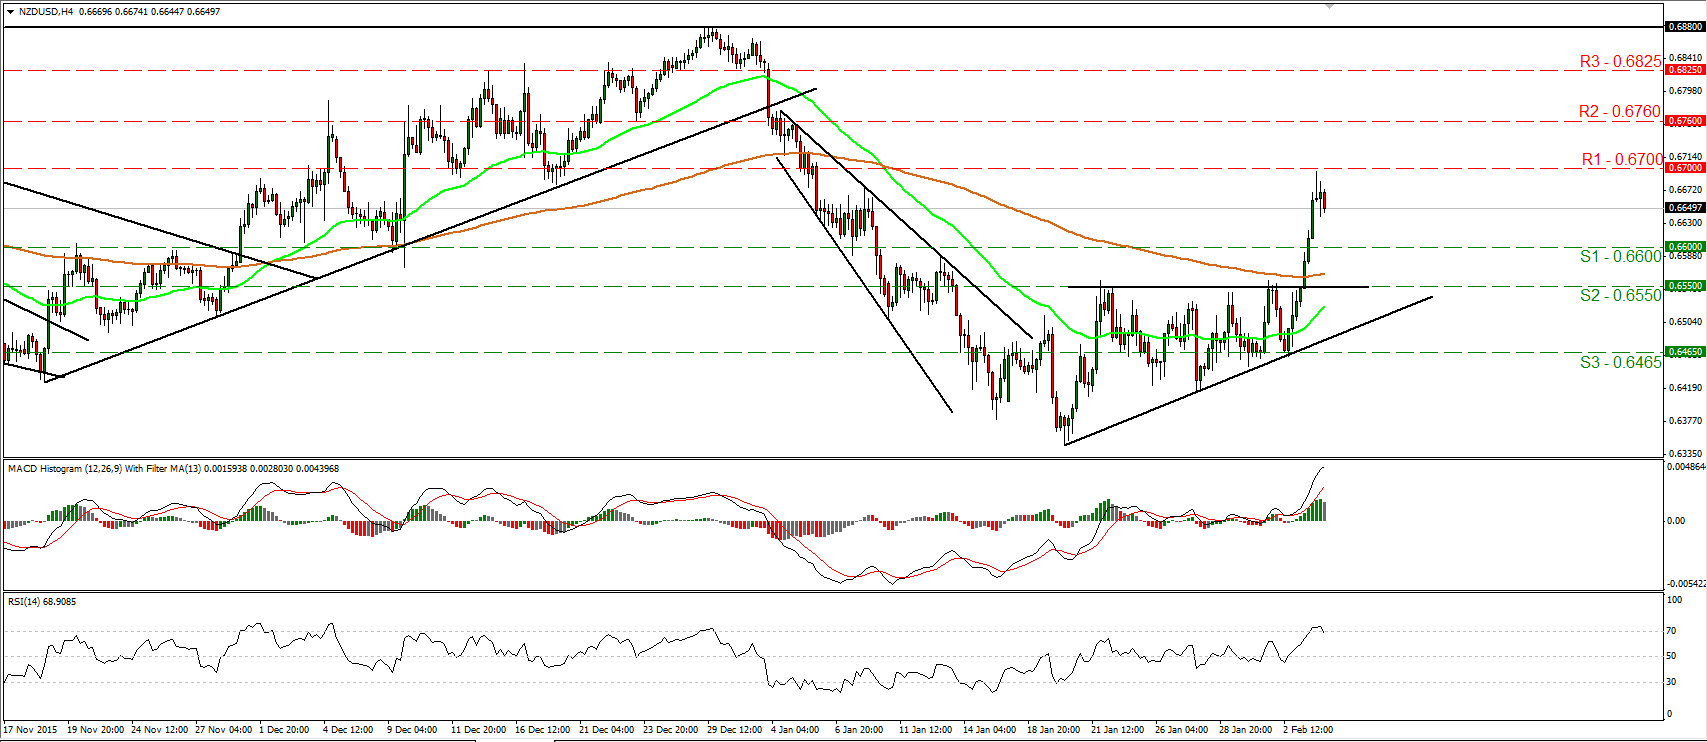
• NZD/USD surged on Wednesday, breaking above the upper bound of an ascending triangle. Nevertheless, the rate hit resistance fractionally below 0.6700 (R1) and then, it retreated somewhat. The escape from the triangle pattern has turned the short-term picture positive in my view and as a result, I would expect at break above 0.6700 (R1) to see scope for extensions towards the next obstacle of 0.6760 (R2). Our oscillators though, give evidence that further retreat could be on the cards before the bulls seize control again. The RSI has topped within its overbought territory and just fell below 70, while the MACD, at extreme positive levels, shows signs that it could start topping. On the daily chart, the recent rebound hit as a resistance the prior upside support line taken from the low of the 23rd of September. This is another reason I believe the pair could pull back in the near term.
• Support: 0.6600 (S1), 0.6550 (S2), 0.6465 (S3)
• Resistance: 0.6700 (R1), 0.6760 (R2), 0.6825 (R3)
Gold emerges above 1132 and hits 1145
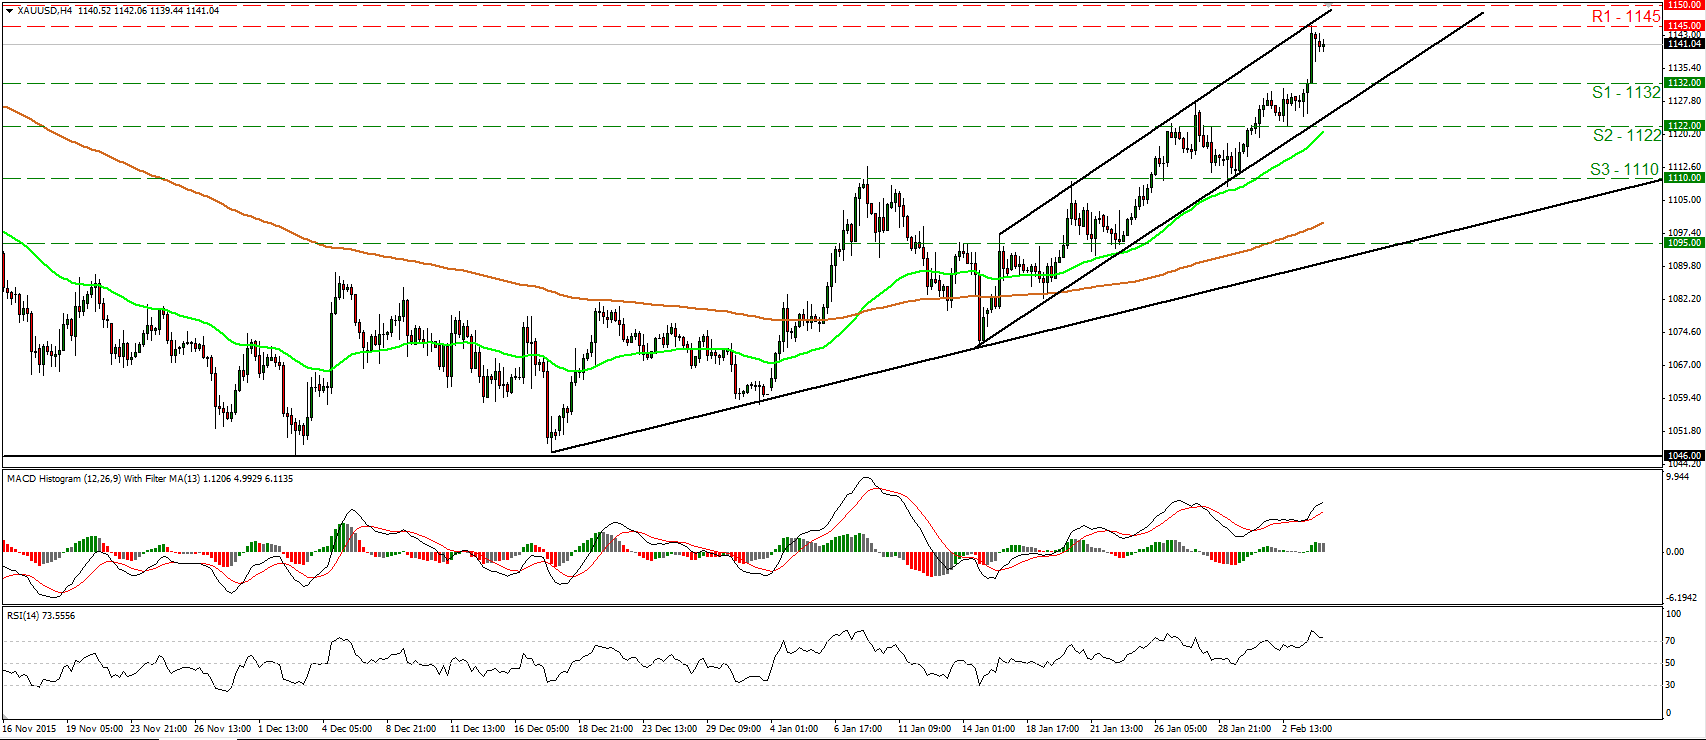
• Gold climbed higher yesterday, breaking above the resistance (now turned into support) line of 1132 (S1) and hitting resistance at 1145 (R1). The price structure remains higher peaks and higher troughs above the short-term uptrend line taken from the low of the 14th of January and as a result, I still see a positive near-term outlook. I believe that the bulls are likely to aim for a test at the psychological zone of 1150 (R2) in the near future. For now though, bearing in mind the proximity of the metal to the upside resistance line taken from the peak of the 15th of January, I would be careful of a possible corrective pull back before the next positive leg. The RSI has topped within its above-70 zone, while the MACD, although positive, has started topping as well. These indicators support somewhat my view that a retreat could be in the works. As for the broader trend, the break above 1110 (S3) on the 26th of January has confirmed a forthcoming higher high on the daily chart, something that keeps the medium-term outlook positive as well.
• Support: 1132 (S1), 1122 (S2), 1110 (S3)
• Resistance: 1145 (R1), 1150 (R2), 1162 (R3)
DAX futures fall below 9600
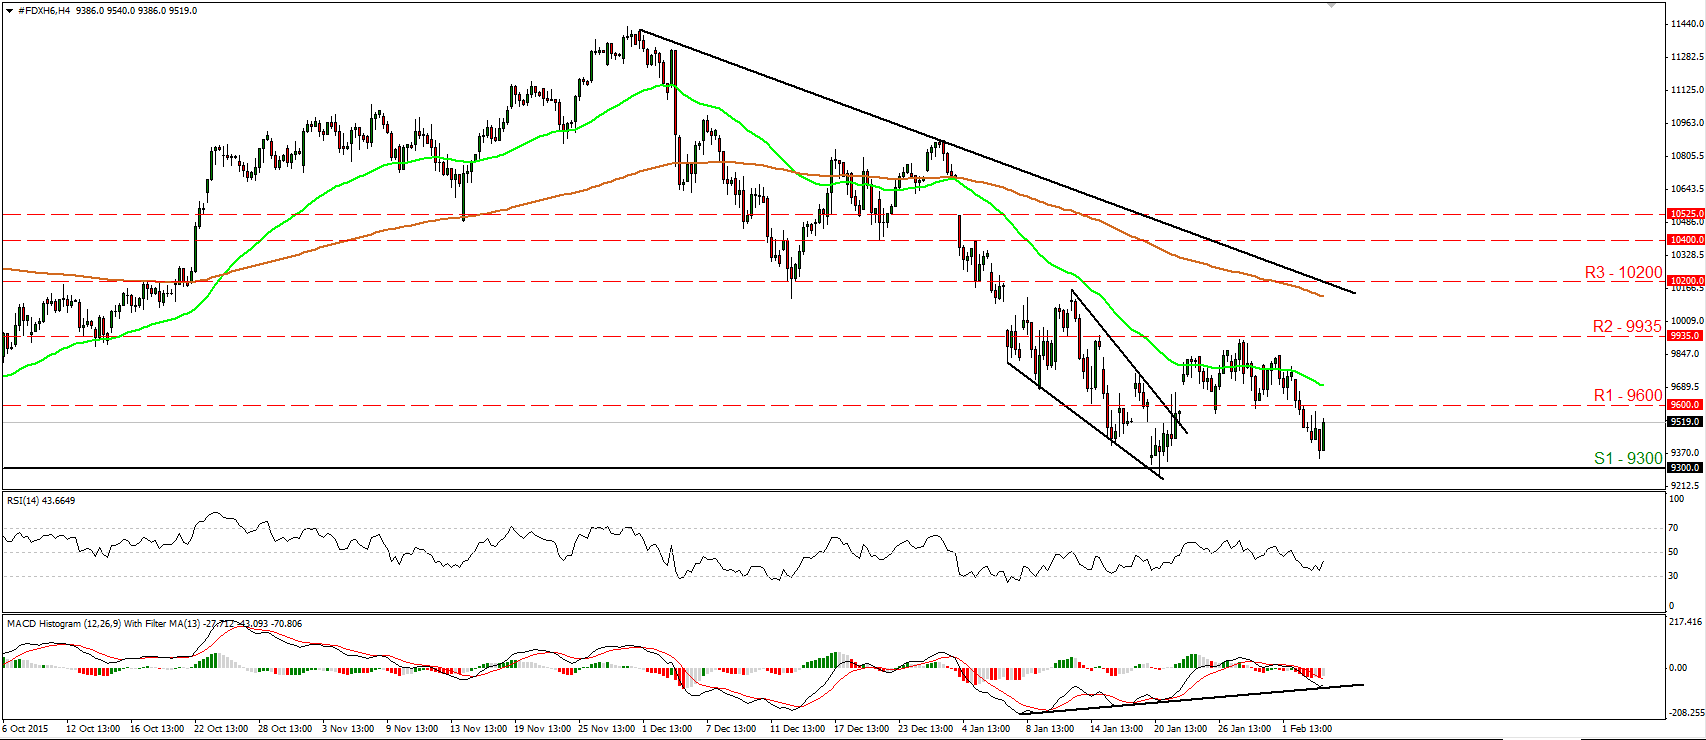
• DAX futures traded lower on Wednesday, falling below the support (turned into resistance) area of 9600 (R1). However, the decline was stopped slightly above the 9300 (S1) key support barrier and then, the index rebounded. Although the price structure suggests a short-term downtrend on the 4-hour chart, I prefer to wait for a clear dip below the key support zone of 9300 (S1) before getting more confident on the downside. Something like that could initially aim for the 9100 (S2) barrier, marked by the low of the 30th of October. For now though, I would expect the current rebound to continue for a while, perhaps even back above the 9600 (R1) line. Our momentum indicators support that the price is possible to correct higher for a while. The RSI rebounded from slightly above its 30 line, while the MACD hit its upside support line and turned up. On the daily chart, I see that since the 1st of December the index has been printing lower peaks and lower troughs, something that keeps the longer-term picture negative.
• Support: 9300 (S1), 9100 (S2), 8900 (S3)
• Resistance: 9600 (R1), 9935 (R2), 10200 (R3)


