The stock market is at all-time highs. Even the financials are starting to participate in the move higher. Throughout this entire 7 year stretch since the financial crisis low there have been a couple of large cap companies that have really lagged though. One of them is Bank of America (NYSE:BAC).
Bank of America stock peaked in November of 2006 at over $45. It lost about 95% of its value down to $2.41 before a bounce. But as the markets have fully recovered and are making new highs Bank of America has recouped just 1/3 of its pre-crisis high.
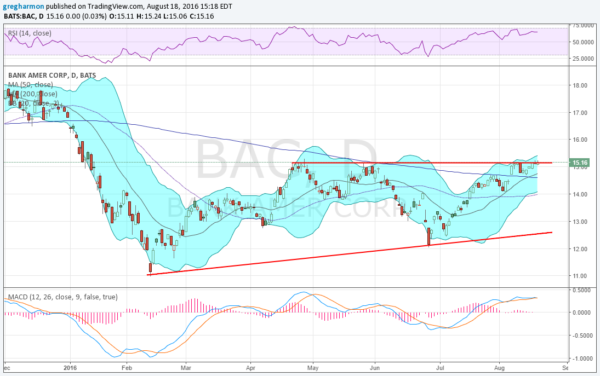
This leaves a lot of room to catch up. And the chart below suggest it may make a runt to recoup some more value shortly.

Since the recent bottom in February it rose to a peak in April and then fell back to a higher low. Now it is back at that prior high again. The price action has built an ascending triangle during this process. A break to the upside carries a target of 19.10.
It has support from bullish momentum indicators. The RSI is rising in the bullish zone while the MACD is flat but avoiding a cross down in positive territory. The Bollinger Bands® are pointing higher as well. And it has moved over its 200 day SMA for the first time this year two weeks ago.
DISCLAIMER: The information in this blog post represents my own opinions and does not contain a recommendation for any particular security or investment. I or my affiliates may hold positions or other interests in securities mentioned in the Blog, please see my Disclaimer page for my full disclaimer.
