Baker Hughes (NYSE:BHI) does pretty much anything and everything related to drilling for oil and gas anywhere. They are involved everywhere. That is why they are the ones that count the active rigs. Since they are somehow involved with everyone, they have an accurate count. And those who follow the count have seen it plummet over the last 12 months.
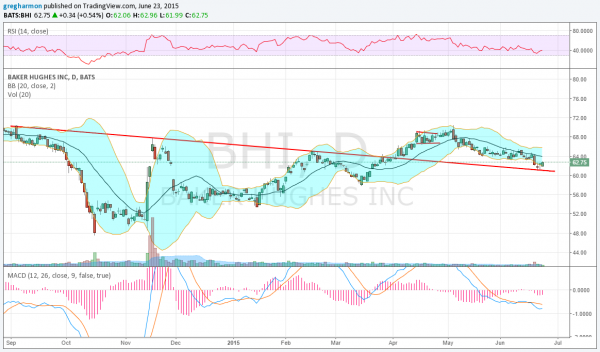
Baker Hughes stock price also did some plummeting, but not nearly as bad as more oil sensitive stocks. It showed up on our radar at the start of April as a possible reversal candidate. From the chart below, you can see it did break out and run higher through April, only to pullback.

That pullback has continued until Monday, but now it might be time to dip your toes back into the stock. The stock closed last week back at the falling trend support (was resistance in April) that it launched above nearly 3 months ago. And what happened? Both Friday and Monday printed bottoming candlesticks and the price is moving higher Tuesday, confirming a reversal.
The RSI is also turned back higher and rising, while the MACD is trying to level and turn higher as well. With a higher low in place, you could use the falling trend line as a stop, giving a great reward to risk ratio, even if it only gets to the top of the Bollinger Bands® near 66.
Disclaimer: The information in this blog post represents my own opinions and does not contain a recommendation for any particular security or investment. I or my affiliates may hold positions or other interests in securities mentioned in the Blog. Please see my Disclaimer page for my full disclaimer.
