Who is Kevin Hassett? Wolfe looks at the Trump ally tipped to become Fed Chair.
Bond prices generally move with stock prices over the long term. Or at least that is what any of us have seen over the last 30 years. But it could be just a coincidence that a 30 year bull market in bond prices happened as stock prices were also rising. Correlations among asset classes come and go, and over shorter time frames bond and stock prices have decoupled as well. This may be another one of those times.
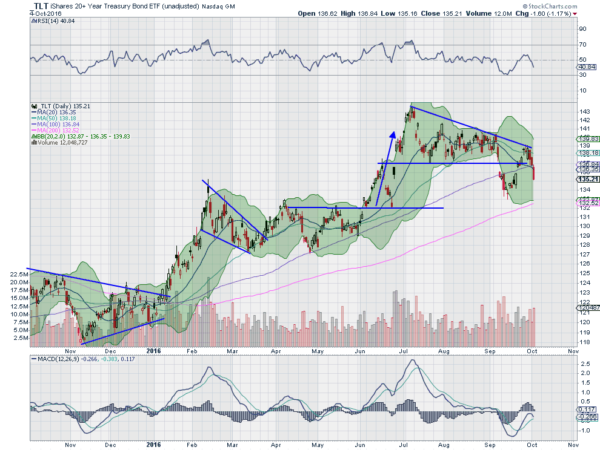
The stock market continues to hover at all-time highs, refusing to sell off. But the bond market has been less kind to investors since July. The iShares 20+ Year Treasury Bond (NASDAQ:TLT) daily chart below shows the story. There is the strong run higher from January through to the beginning of July. And then bond prices moved sideways. So far this mirrors stock price movements.

But then the price of bonds fell in September. The chart shows a break down out of a descending triangle pattern. Prices found support quickly and then rallied back higher. But this time to a lower high. That lower high aligned with the falling trend resistance of the prior triangle. And now prices are moving lower again. A move down below the September low at 133.03, making for a lower low, would confirm a change of trend to a downtrend.
With the 200 day SMA, the highest level bull market support indicator, near that level it may find support. But if it does not the 30 year rally may be coming to an end. We will not know whether the long run bull market rally in bonds has ended until well after it has begun. It will take a short run change of character, like what is going on now, to start it though. Time to pay attention.
The information in this blog post represents my own opinions and does not contain a recommendation for any particular security or investment. I or my affiliates may hold positions or other interests in securities mentioned in the Blog, please see my Disclaimer page for my full disclaimer.
