Avis Budget Group, Inc. (CAR) operates in two brands in the global vehicle rental industry through Avis and Budget. Avis is a rental car supplier positioned to serve the commercial and leisure segments of the travel industry and Budget is a rental car supplier.
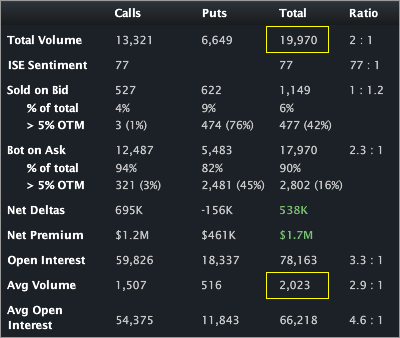
This is an order flow note -- a repeated trade three days in a row for size -- but it's not what it seems at first blush. CAR has traded just under 20,000 contracts on total daily average option volume of just 2,023. The largest trade was a purchase of 10,000 Mar 14 calls for $1.45. The next largest trade is a 308 lot -- so the calls are the story. The Stats Tab and Day's biggest trades snapshots are included (below).


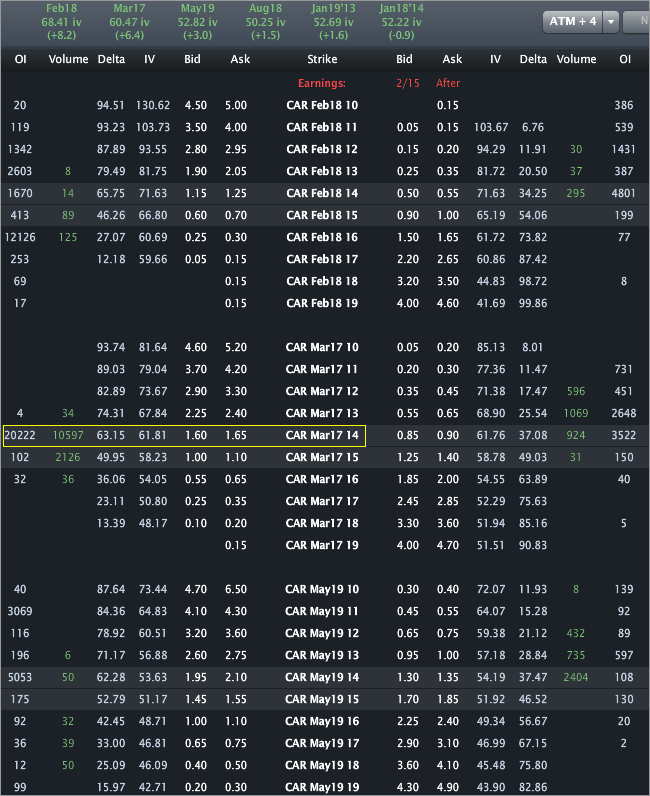
Here's where it gets cool. The OI as of Wed morning in that strike was in the two hundred range. Then these two trades hit on Wed and Thurs.

So we can see on Wed and Thurs (and now Fri) 10,000 Mar 14 calls have been purchased for $1.40, $1.30 and $1.45, respectively. That's massively bullish right? Well, no...
That means 75% of the long calls are in fact long puts (remember put-cal parity). Said differently, it's not a 30,000 long call position, it's 22,500 long puts and 7,500 long calls. That's bearish -- massively so given the vega position. I've included the stock trade from today, below. Using the vega as of today, we're looking at ~$57,000 of vega -- so the position rises (loses) that much for each vol point increase (decrease), ceteris paribus.
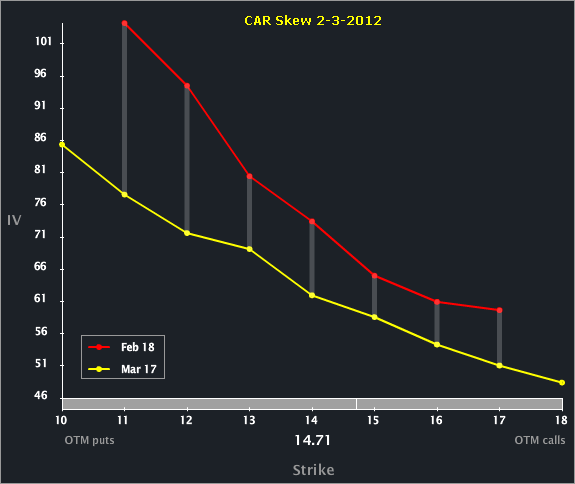
The Skew Tab snap (below) illustrates the vols by strike by month.

We can see the front is elevated to the back -- that's a reflection of earnings which are due out right before Feb expo per Livevol® projections. But, perhaps this is a bet that earnings come out in Mar given the vega. In fact, if the stock sits still and the vol pops 10 points (it's up 6.4 vol points in Mar today) in Mar off of a company announcement of an earnings date, that's a half million dollar win.
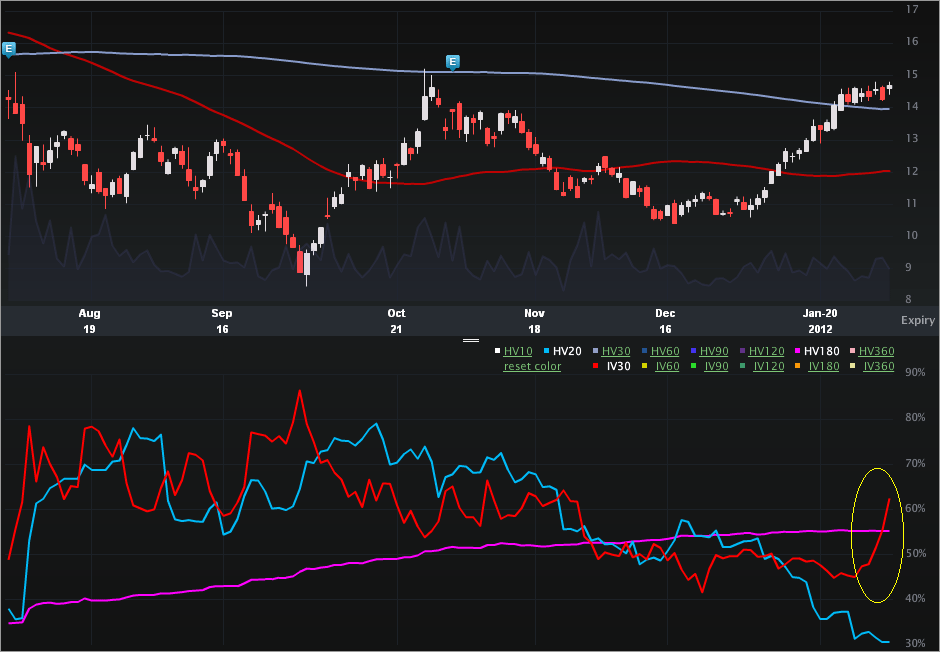
The shape of the skew isn't really the vol story -- for that we need a more holistic view. Let's turn to the Charts Tab (6 months), below. The top portion is the stock price, the bottom is the vol (IV30™ - red vs HV20™ - blue vs HV180™ - pink).

First, the stock portion shows a substantial gain over the last month -- the stock is up ~37% in that time. The vol had been fairly muted, even declining into that rally... until a week ago. IV30™ was 45.08% and is now 62.18%, or a 38% increase with a 12% increase today, alone.
The 52 wk range in IV30™ for CAR is [36.42%, 86.40%] which puts the current level in the 52nd percentile. From a purely curious place, I'm very interested to watch what happens in CAR into Mar expo. Note that the order flow is in Mar -- so either it's a bet that earnings actually fall into Mar and NOT Feb, or... it's something else...
This is trade analysis, not a recommendation.
This is an order flow note -- a repeated trade three days in a row for size -- but it's not what it seems at first blush. CAR has traded just under 20,000 contracts on total daily average option volume of just 2,023. The largest trade was a purchase of 10,000 Mar 14 calls for $1.45. The next largest trade is a 308 lot -- so the calls are the story. The Stats Tab and Day's biggest trades snapshots are included (below).


Here's where it gets cool. The OI as of Wed morning in that strike was in the two hundred range. Then these two trades hit on Wed and Thurs.

So we can see on Wed and Thurs (and now Fri) 10,000 Mar 14 calls have been purchased for $1.40, $1.30 and $1.45, respectively. That's massively bullish right? Well, no...
That means 75% of the long calls are in fact long puts (remember put-cal parity). Said differently, it's not a 30,000 long call position, it's 22,500 long puts and 7,500 long calls. That's bearish -- massively so given the vega position. I've included the stock trade from today, below. Using the vega as of today, we're looking at ~$57,000 of vega -- so the position rises (loses) that much for each vol point increase (decrease), ceteris paribus.
The Skew Tab snap (below) illustrates the vols by strike by month.

We can see the front is elevated to the back -- that's a reflection of earnings which are due out right before Feb expo per Livevol® projections. But, perhaps this is a bet that earnings come out in Mar given the vega. In fact, if the stock sits still and the vol pops 10 points (it's up 6.4 vol points in Mar today) in Mar off of a company announcement of an earnings date, that's a half million dollar win.
The shape of the skew isn't really the vol story -- for that we need a more holistic view. Let's turn to the Charts Tab (6 months), below. The top portion is the stock price, the bottom is the vol (IV30™ - red vs HV20™ - blue vs HV180™ - pink).

First, the stock portion shows a substantial gain over the last month -- the stock is up ~37% in that time. The vol had been fairly muted, even declining into that rally... until a week ago. IV30™ was 45.08% and is now 62.18%, or a 38% increase with a 12% increase today, alone.
The 52 wk range in IV30™ for CAR is [36.42%, 86.40%] which puts the current level in the 52nd percentile. From a purely curious place, I'm very interested to watch what happens in CAR into Mar expo. Note that the order flow is in Mar -- so either it's a bet that earnings actually fall into Mar and NOT Feb, or... it's something else...
This is trade analysis, not a recommendation.
