Consumer sentiment in Australia declined 1.2% in August. Westpac Melbourne Institute Index of Consumer Sentiment dropped to 95.5 in August compared with 96.6 in July. The Consumer sentiment has been below 100 for the last nine months. A reading below 100 indicates that the number of people pessimistic about the economy is greater than the number of people who are optimistic.
However, labor market in Australia is resilient, as reflected by the jobs report of June 2017. Full-time jobs surged 62,000 in June compared with 53,400 in May, the biggest two-month increase since 1988. Part-time jobs on the other hand fell 48,000 in June for a net increase of 14,000 jobs. Moreover, Australian job ads escalated for the fifth straight month in July, increasing 1.5% to 177,879, per Business Insider (read: Australian Employment Advances: ETFs in Focus).
Although the employment data coupled with lower fuel prices should boost sentiment, poor wage growth, higher electricity costs and rate hike worries weigh on it.
However, Australia’s housing market is booming and the Reserve Bank of Australia (RBA) left rates unchanged in its July Monetary Policy Committee meeting. Some economists predict that the housing market has peaked and if the RBA goes on an aggressive rate hiking spree, the housing market could crash. Therefore, the path RBA will adopt in regard to interest rates is still quite uncertain.
Consumer prices in Australia expanded 0.2% quarterly in Q2 compared with estimates of 0.4% and 1.9% annually compared with the 2.2% estimate. Reserve Bank of Australia (RBA) targets inflation to be in the range of 2–3%.
The lower-than-expected inflation is primarily being attributed to falling oil prices. This strengthens the possibility of interest rates remaining unchanged in the near future.
Let us now discuss a few ETFs focused on providing exposure to the Australian economy (see all Asia-Pacific (Developed) ETFs here).
IShares MSCI Australia Index Fund EWA:
This fund is the most popular Australia ETF in the space, offering exposure to the most liquid equities in the Australian economy. It tracks the MSCI Australia Index.
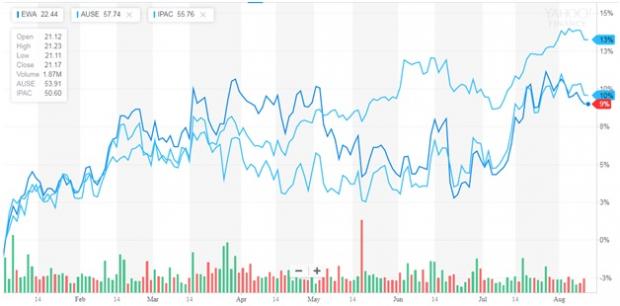
This fund has AUM of $1.75 billion and charges a relatively moderate fee of 48 basis points a year. From a sector look, Financials, Materials and Real Estate are the top three allocations of the fund, with 42.72%, 16.69% and 8.39% exposure, respectively (as of August 8, 2017). Commonwealth Bank Of Australia, Westpac Banking Corporation Corp and Australia and New Zealand Banking group are the top three holdings of the fund, with 10.94%, 8.43% and 6.86% allocation, respectively (as of August 8, 2017). The fund has returned 8.98% year to date and 6.35% in the last one year (as of August 9, 2017). EWA currently has a Zacks ETF Rank #3 (Hold) with a Medium risk outlook (read: China's Inflation, Debt & Impact on Australia: ETFs in Focus).
WisdomTree Australia Dividend Fund AUSE:
This ETF is another popular fund offering exposure to the Australian economy and tracks the WisdomTree Australia Dividend Index.
This fund has AUM of $37.53 million and charges a fee of 58 basis points a year. From a sector look, Financials, Consumer Discretionary and Basic Materials are the top three allocations of the fund, with 24.16%, 17.39% and 13.86% exposure, respectively (as of August 9, 2017). Harvey Norman Holdings Ltd, Fortescue Metals Group Ltd and National Australia Bank Ltd are the top three holdings of the fund, with 4.56%, 3.55% and 3.06% allocation, respectively (as of August 9, 2017). The fund has returned 9.56% year to date and 8.59% in the last one year (as of August 9, 2017). AUSE currently has a Zacks ETF Rank #3 with a Medium risk outlook.
Let us now compare the performance of these ETFs with a broader Asia Pacific based ETF, IPAC.
iShares Core MSCI Pacific ETF IPAC
This fund focuses on providing exposure to equities of the Asia Pacific region.
This fund has AUM of $1.08 billion and charges a fee of 10 basis points a year. From a geographical perspective, Japan, Australia and Hong Kong round up the top three spots, with 66.83%, 19.07% and 9.4% exposure, respectively (as of August 8, 2017). From a sector look, Financials, Industrials and Consumer Discretionary are the top three allocations of the fund, with 19.47%, 17.71% and 15.64% exposure, respectively (as of August 8, 2017). Toyota Motor Corp, Commonwealth Bank of Australia and AIA Group Ltd are the top three holdings of the fund, with 2.46%, 1.77% and 1.57% allocation, respectively (as of August 8, 2017). The fund has returned 13.24% year to date and 10.94% in the last one year (as of August 9, 2017). IPAC currently has a Zacks ETF Rank #3 with a Medium risk outlook.
Below is a chart comparing the year to date performance of the three funds.

Source: Yahoo (NASDAQ:AABA) Finance
Want key ETF info delivered straight to your inbox?
Zacks’ free Fund Newsletter will brief you on top news and analysis, as well as top-performing ETFs, each week. Get it free >>
ISHARS-AUSTRAL (EWA): ETF Research Reports
ISHRS-MSCI PAC (IPAC): ETF Research Reports
WISDMTR-AUS DVD (AUSE): ETF Research Reports
Original post
Zacks Investment Research
