AUDUSD
Yep, another day on the Aussie which happens to be one of my favorite pairs to trade daily. Yesterday I talked about how the impulsive price action selling on the pair, combined with a bearish engulfing bar, clued me into further selling for the pair.
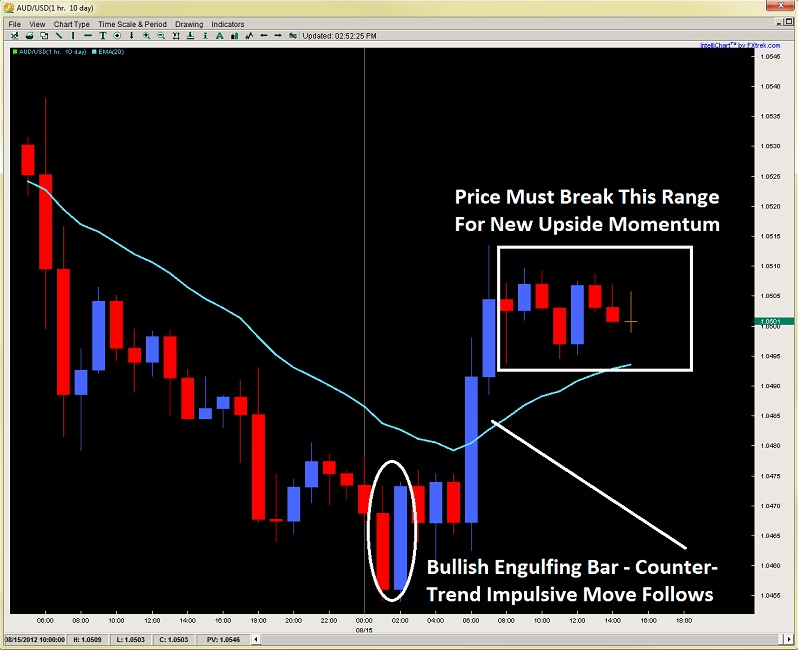
As many of you know from my impulsive and corrective price action theory, the impulsive to corrective series will continue until it finds a counter-trend impulsive move. That is exactly what happened today, ironically via an intraday engulfing bar of the support zone we’ve been talking about around 1.0450 area. The pair then see-sawed for 3hrs forming a bear-bull-bear candle series, only to form a bullish engulfing bar communicating the buyers were now in full and others had joined the party.
The pair has since formed a flag/wedge at the top of the daily range, so am favoring the upside, but there is some decent resistance above with the daily highs at 1.0515, along with the 4hr 20ema at that same level. So it will need to clear this to bring in new bulls on a break, but if others suspect a STB (short term bottom) is in place, they will likely buy on a pullback to the key intraday flag support at 1.0496, so two plays for bulls while bears have their levels to sell at.

Global Market Commentary:
While global stocks continue to do nothing and have been as exciting as banging one’s head on a curb, investors are really just sitting on the sidelines praying hoping the CB’s of the world will hit CTRL + P and push markets higher, because we all know, a strong DOW is important to the corporate executives stock holdings economy for creating jobs.
Oil woke up from its crude slumber sparked by possible production/disruption fears as Saudi Arabia recalled its citizens from Lebanon, sparking general Mid-East/Iran War fears.
I would like to note the ultra low volume in the S&P which has been some of the lowest in years. In fact, its intraday ranges for the last 8 days have been so dismal, that 7 of the last 8x we had 8 day trading ranges this low, it has usually market a significant top in the S&P. See chart here (source ZeroHedge) so we could be seeing a major top in the index which is hovering just below the yearly highs and double top at 1420.
Yep, another day on the Aussie which happens to be one of my favorite pairs to trade daily. Yesterday I talked about how the impulsive price action selling on the pair, combined with a bearish engulfing bar, clued me into further selling for the pair.
As many of you know from my impulsive and corrective price action theory, the impulsive to corrective series will continue until it finds a counter-trend impulsive move. That is exactly what happened today, ironically via an intraday engulfing bar of the support zone we’ve been talking about around 1.0450 area. The pair then see-sawed for 3hrs forming a bear-bull-bear candle series, only to form a bullish engulfing bar communicating the buyers were now in full and others had joined the party.
The pair has since formed a flag/wedge at the top of the daily range, so am favoring the upside, but there is some decent resistance above with the daily highs at 1.0515, along with the 4hr 20ema at that same level. So it will need to clear this to bring in new bulls on a break, but if others suspect a STB (short term bottom) is in place, they will likely buy on a pullback to the key intraday flag support at 1.0496, so two plays for bulls while bears have their levels to sell at.

Global Market Commentary:
While global stocks continue to do nothing and have been as exciting as banging one’s head on a curb, investors are really just sitting on the sidelines praying hoping the CB’s of the world will hit CTRL + P and push markets higher, because we all know, a strong DOW is important to the corporate executives stock holdings economy for creating jobs.
Oil woke up from its crude slumber sparked by possible production/disruption fears as Saudi Arabia recalled its citizens from Lebanon, sparking general Mid-East/Iran War fears.
I would like to note the ultra low volume in the S&P which has been some of the lowest in years. In fact, its intraday ranges for the last 8 days have been so dismal, that 7 of the last 8x we had 8 day trading ranges this low, it has usually market a significant top in the S&P. See chart here (source ZeroHedge) so we could be seeing a major top in the index which is hovering just below the yearly highs and double top at 1420.
