The Reserve Bank of Australia met earlier today and opted to leave the cash rate unchanged at 1.50% as widely expected. Policy makers did not give much information on whether there will be another rate cut but signaled the risks to the housing market. The markets viewed the comments as being less gloomy with the central bank noting that in its assessment, it saw borrowing rise little during the month of February.
AUD/USD rallied to a 3-day high posting intraday high at 0.7633 after the RBA's announcement before sliding back.
On the economic front, data today will focus on the U.S. trade balance numbers and consumer credit data.
AUD/NZD intra-day analysis

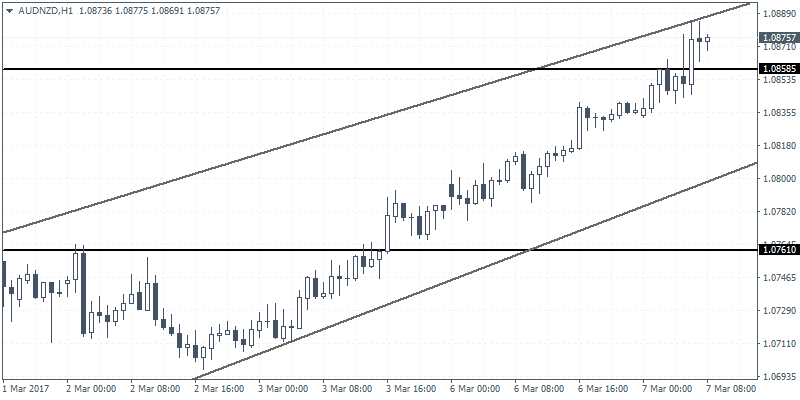
AUD/NZD (1.0875): The Australian dollar has seen some strong gains this morning following the RBA's rate decision. The kiwi, on the other hand, is trading subdued with data from earlier this week showing weaker dairy prices. On the hourly chart on AUD/NZD, price action has formed a doji near the top end of the rally with prices consolidating into a steep wedge pattern. Near term support at 1.0858 is the initial obstacle as a break below this level could signal further downside towards 1.0761. Also, watch for a potential inside bar formation on the hourly chart for AUD/NZD which will be another clue for the downside in price action.
EUR/GBP intra-day analysis

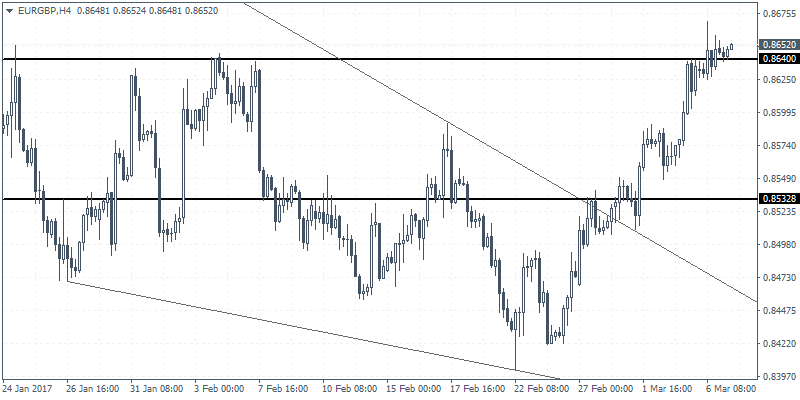
EUR/GBP (0.8652) resumed its bullish trail once again with prices seen testing 0.8640 resistance level yesterday. The rally to 0.8640 comes following the upside breakout from the triangle/wedge pattern near the support level at 0.8532. Further upside is expected in EUR/GBP which will see prices eventually rally towards the next main resistance level at 0.8778 which is pending a retest of resistance. Establishing resistance here will signal downside in prices with the overall bearish trend likely to be rekindled.
GBP/USD intra-day analysis

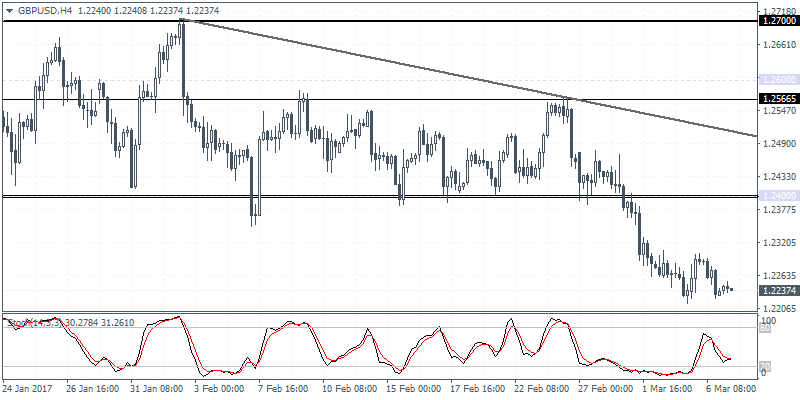
GBP/USD (1.2237) turned bearish yesterday, and the intraday price action looks to be targeting the support level at 1.2200. From the 4-hour charts, the price action is starting to look vulnerable for further downside following the descending triangle pattern that was formed and the breakdown below the support level at 1.2400. Further declines are expected towards 1.2200 with the continuation in the bearish price action likely to see declines towards 1.2100.
