Investing.com’s stocks of the week

With last week’s FOMC meeting and Friday’s Non Farm Payroll release firmly consigned to history, it seems that the temporary blip in the US dollar was just that, with the status quo returning in early trading in London with the US dollar picking up it’s longer term bullish momentum once again. That said, it is often easy to assume that strength or weakness in one currency then translates universally across the pairs. But this is frequently not the case.
For the four currency majors of the AUD/USD, the GBP/USD, the EUR/USD and the USD/CAD, we have seen a degree of divergence where whilst the last three (GBP/USD, EUR/USD & USD/CAD) have reflected US dollar strength, for the AUD/USD we have been observing a very different technical picture. As the others have moved lower, the AUD/USD has moved into a congestion phase accompanied by a modicum of bullish sentiment over the last few days.
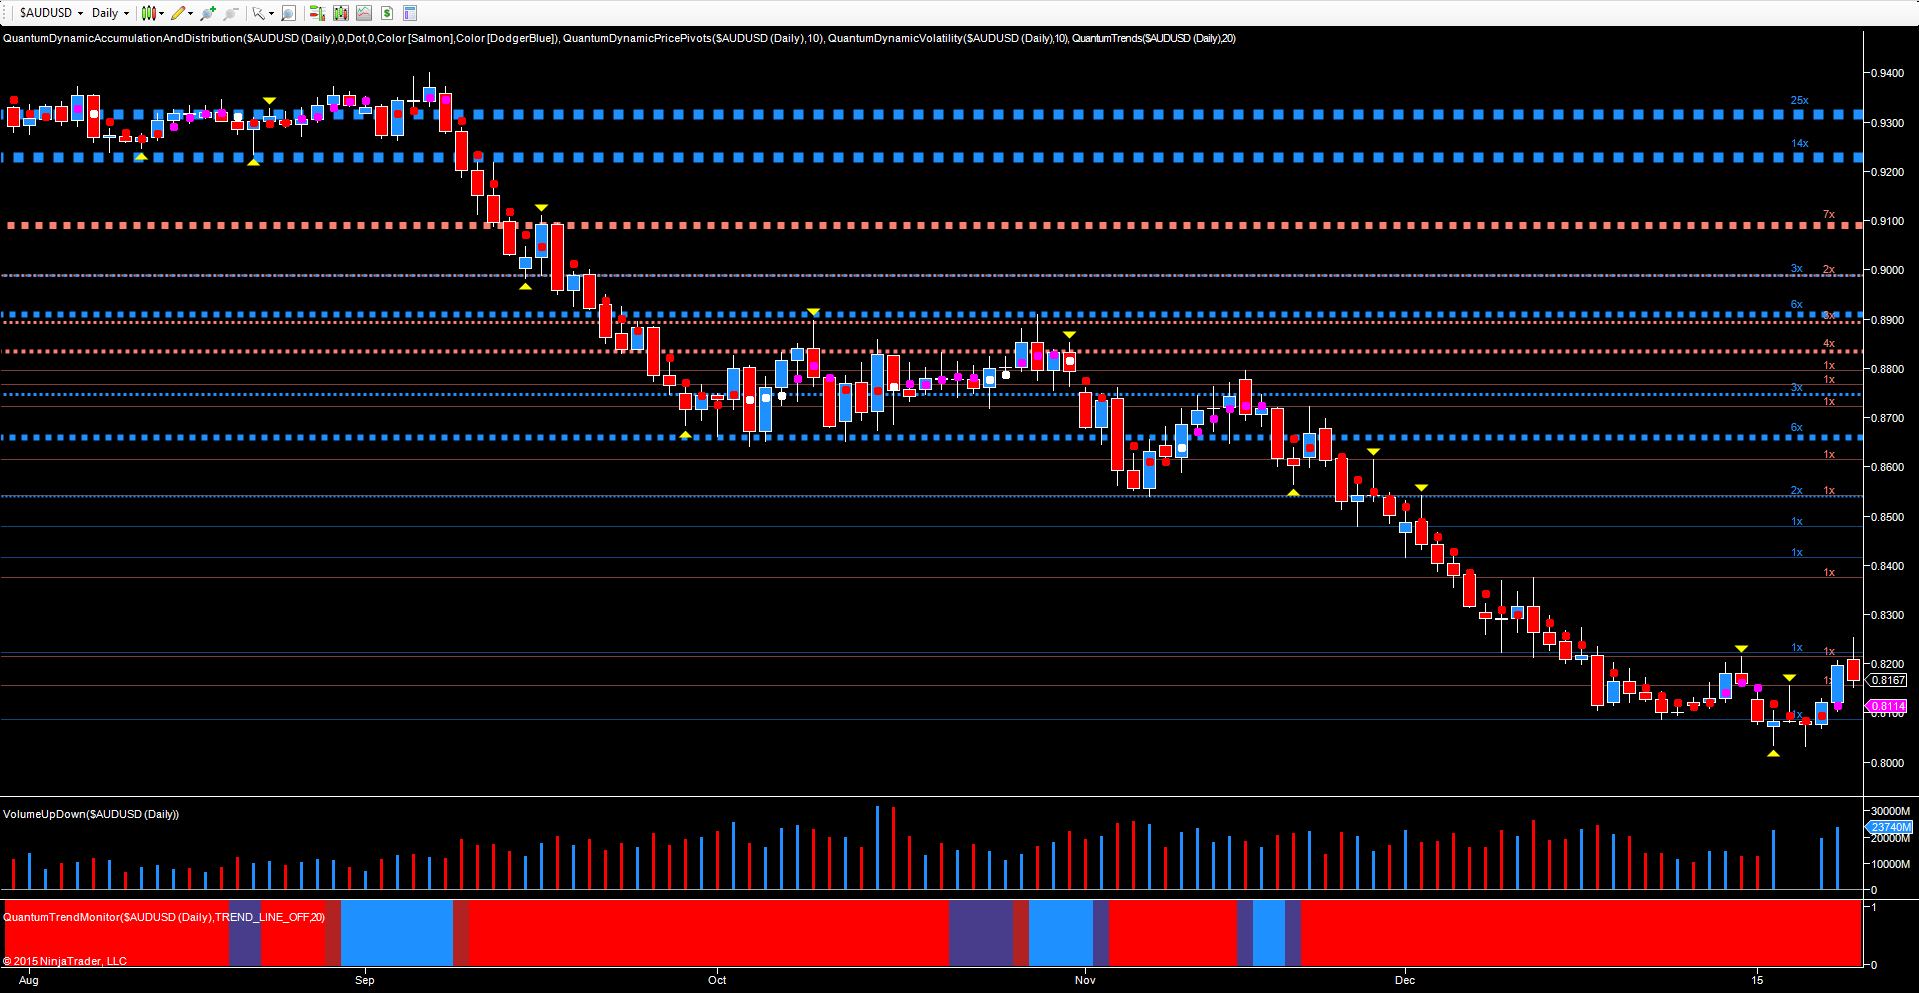
We can see this reflected on the daily chart for the AUD/USD, with the pair finding price support in the 0.8020 region with the pivot low of January 5th defining the upper region of support and the pivot high of the 31st of December- January then defining the ceiling.
This low was duly tested once more two days later, but held firm, with Friday’s move higher closing with a wide spread up candle on good volume and confirming the consolidation phase which is now starting to build for the Aussie dollar. However, for any sustained move higher the key level is now above the 0.8200 region, and if this level is regained in due course, this will then provide a platform for some further upside momentum, running against the broader trend for USD strength.
From a fundamental perspective we do not have any major items of news save for employment change and the unemployment rate on Wednesday. The key item of news for the Aussie does not come until early next month, namely 2nd February with the RBA interest rate decision, policy statement and trade balance which may provide some pointers as to the medium and longer term trend for the AUD/USD.

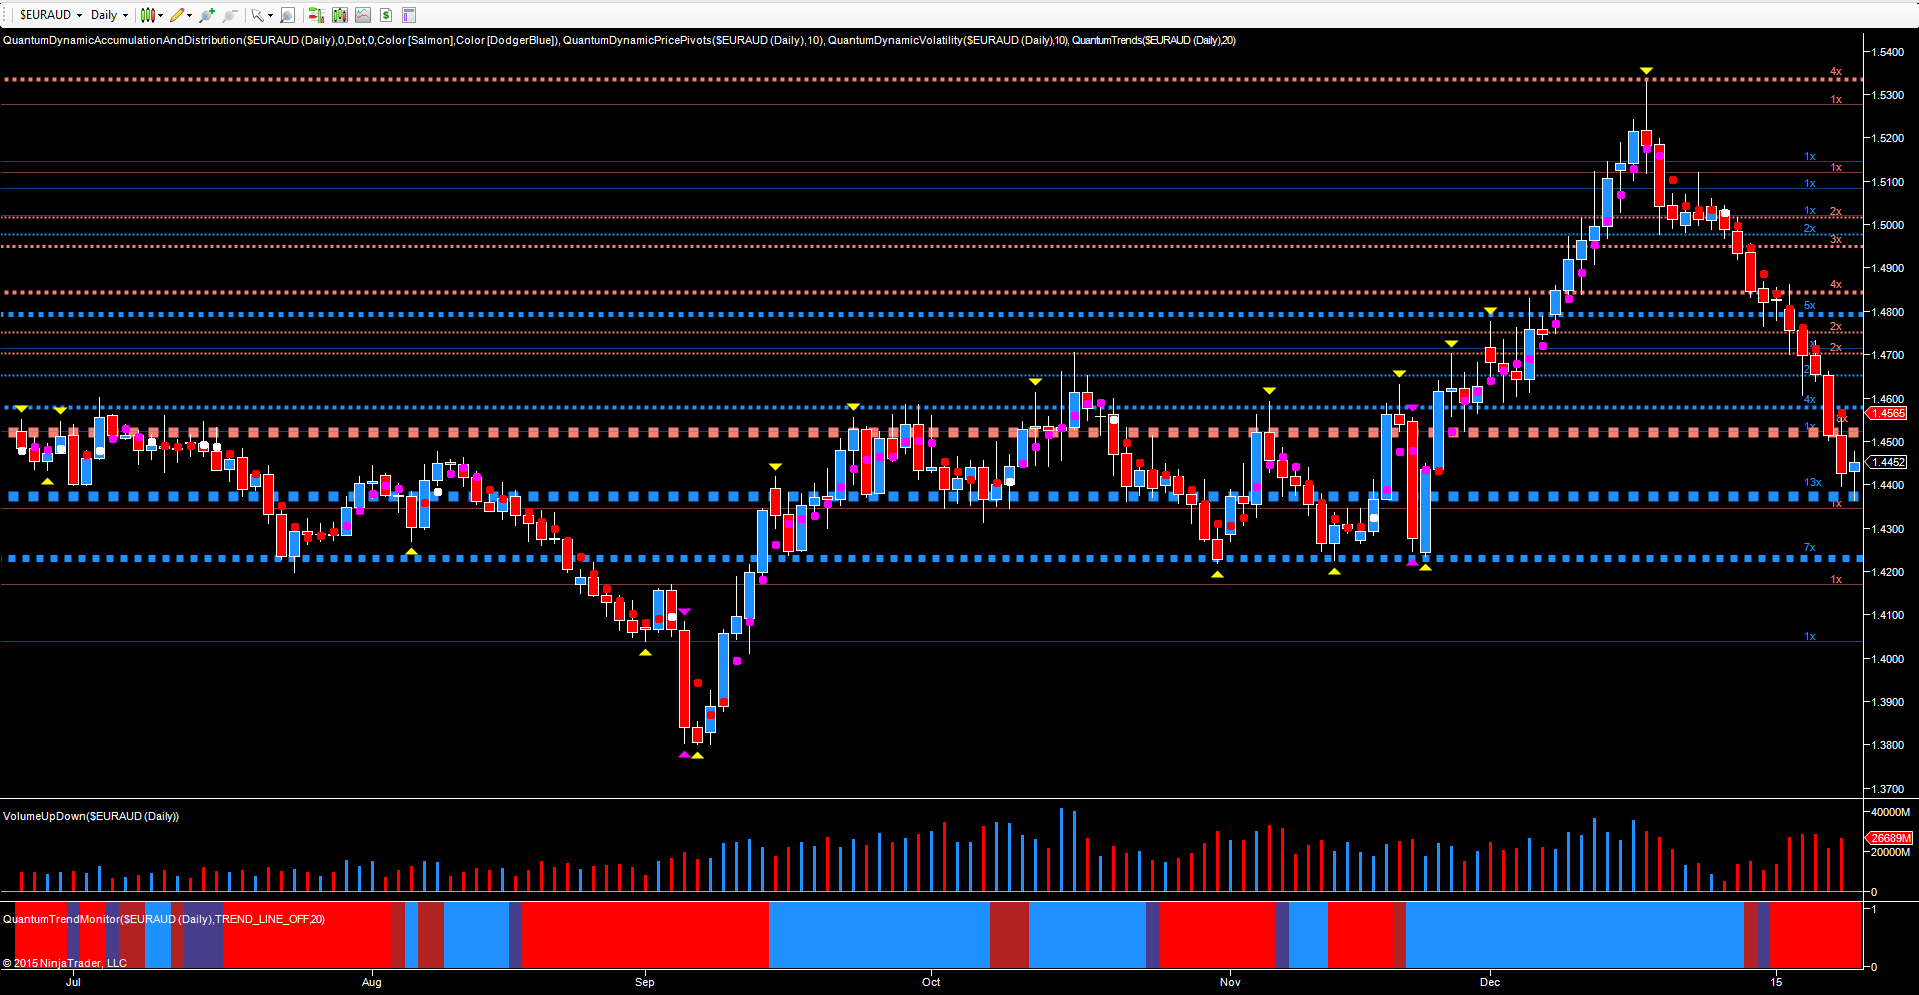
In the current trading environment for the AUD/USD it is often easy to forget the cross pairs where the market’s sentiment may be easier to gauge, and for the Aussie some of the best trades have been in the EUR/AUD where we have seen a dramatic sell off for the EUR/USD with a consequent strong buy for the Aussie. The daily chart now reveals a potential pause point at the 1.44 region, but if this level fails to hold then expect further downside momentum towards the sustained platform of support in the 1.4240 region.

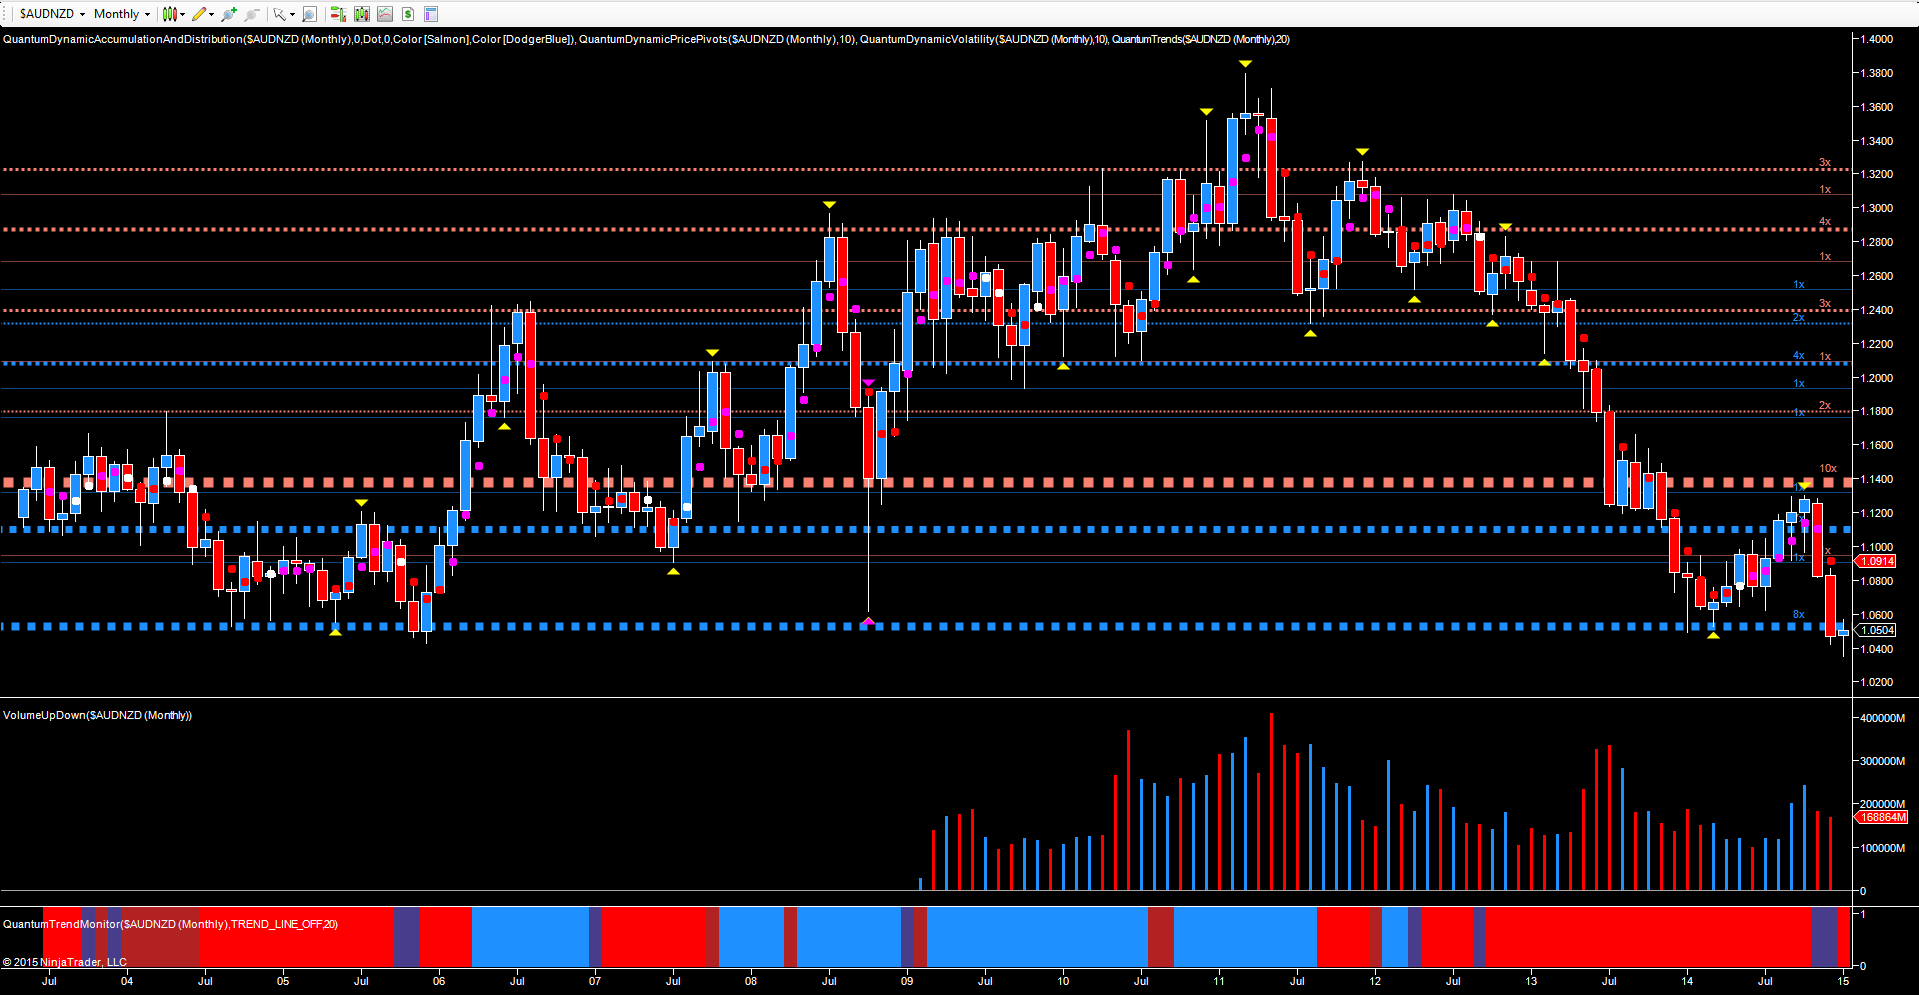
Meanwhile, another important Aussie cross is the AUD/NZD where again buying in the Aussie has appeared in the past couple of trading sessions, and here it is monthly chart which is the most revealing, as the pair try to bounce off the platform of price support at 1.0506. However, it is the performance of the Kiwi which may determine whether the current bullish tone is maintained or not.
