Australia exports down 5%
Australia’s trade surplus narrowed to A$4.5 billion in October, a large miss from the A$6.1 billion expected and well below September’s downwardly-revised A$6.8 billion surplus. That’s the smallest surplus since December 2018. The decline came on the back of a 5% decline in exports, the biggest drop since April 2017.
Retail sales growth slowest in six months
In other data, growth in retail sales in Australia was zero for October, data released by the Australian Bureau of Statistics showed today. That was far less than the +0.3% expected by analysts and below September’s 0.2% gain. Statements from the ABS accompanying the release showed falls for clothing, footwear and personal accessories. October’s numbers were the weakest in six months.
Aussie drops after data
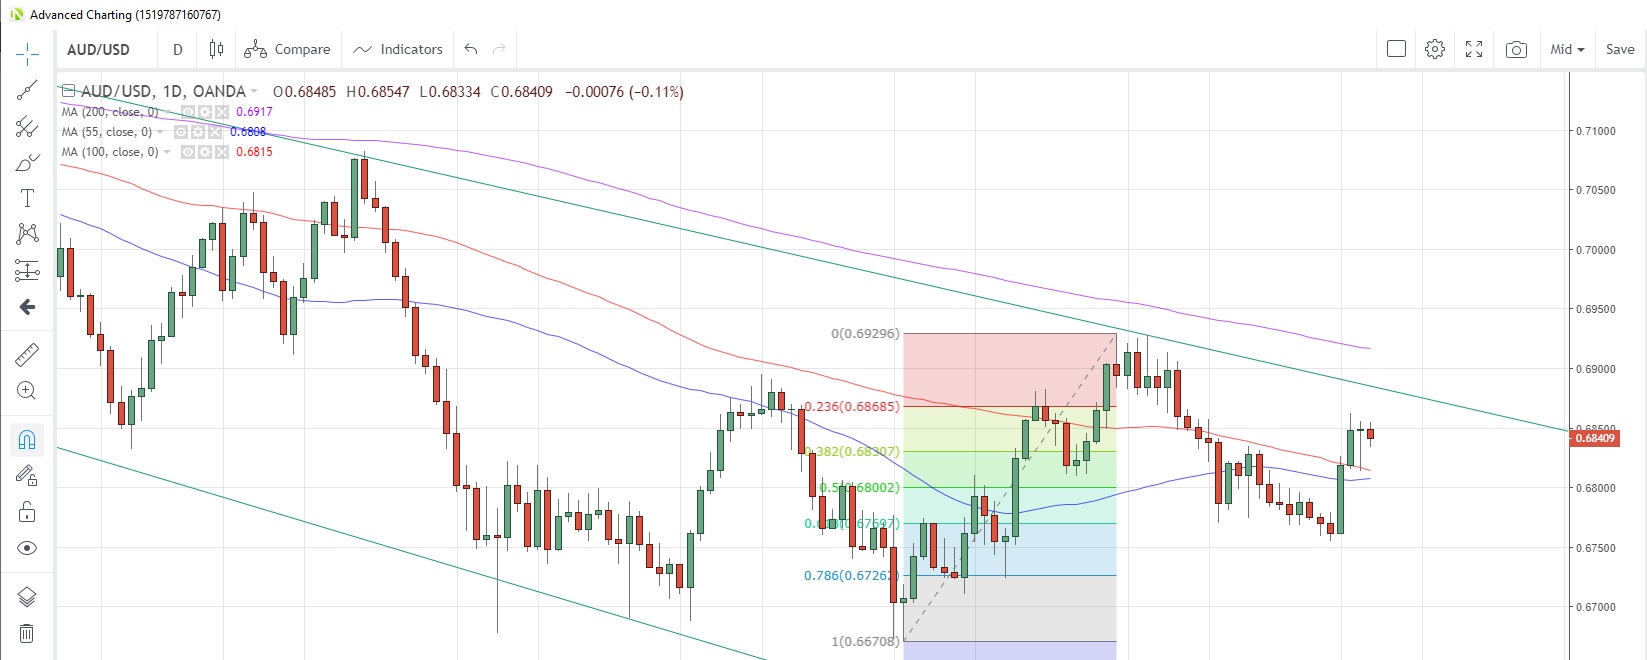
Both sets of data were negative for the local dollar, with AUD/USD dropping to 0.6833 and AUD/JPY sliding to 74.35 immediately afterward. However, those losses proved to be short-lived as both pairs have recovered to be almost flat on the day. AUD/USD remains capped near-term by a falling trendline which started a year ago. The 200-day moving average is above at 0.6917.
AUD/USD Daily Chart

Deal off, deal on….
Barely 24 hours after saying he was in no rush to sign a US-China trade deal, possibly waiting until after the November 2020 election, US President Trump said the talks were going very, very well. Indeed, citing unofficial comments, the US press was speculating that a deal could be agreed ahead of the December 15 deadline, a date when the next set of tariffs are due to be introduced. Given that China had called for a total rollback of current tariffs and a suspension of pending ones before a Phase 1 deal could be signed, it remains to be seen how far this back-tracking will go.
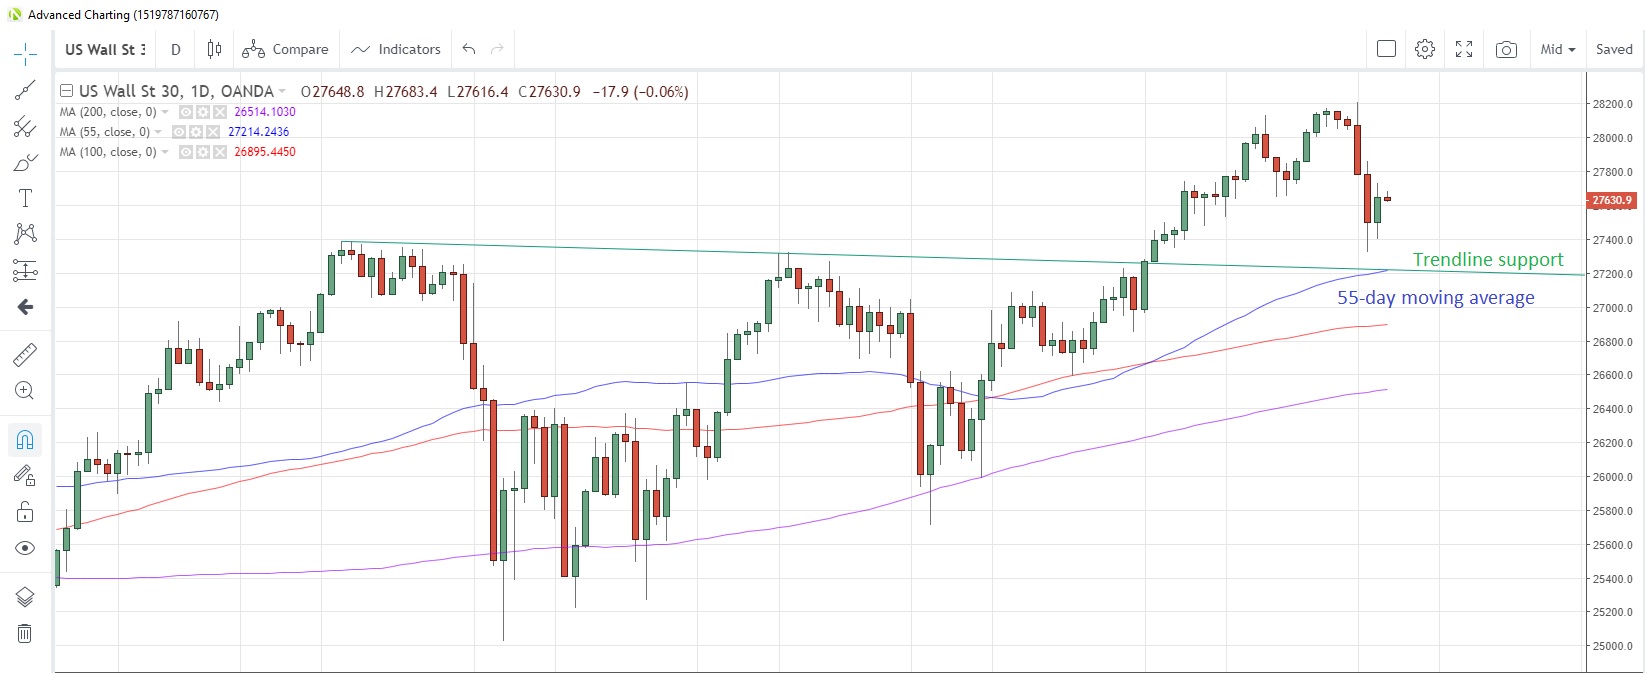
Wall Street reacted positively to the rumours yesterday, snapping a four-day decline but the momentum has failed to continue into the Asian morning, with US indices retreating between 0.04% and 0.08%. The US30 index is holding above the 55-day moving average at 27,214, as it has done since October 10.
US30 Daily Chart

RBI seen cutting rates
A weakening economy and benign inflation is likely to justify the Reserve Bank of India delivering a 25 bps cut to both the repo and reverse repo rates at today’s meeting. That would be the sixth reduction in rates this year.
The rest of today’s calendar features German factory orders for October (slower expansion expected) and Euro-zone retail sales (negative growth seen). The North American session sees the US trade balance and factory orders for October released. The former is expected to show a narrowing of the deficit to $48.7b from $52.5b, while the latter probably rose 0.3% m/m after a 0.6% decline in September.
Canada’s October trade data and Ivey PMI data for November together with a speech from Fed’s Quarles completes the session.
