Currency bears on Friday drove the Australian dollar sharply lower against the greenback, which resulted in a fresh 2018 low in AUD/USD. Does this deterioration mean that the road south is wide open?
EUR/USD Vs. Channel
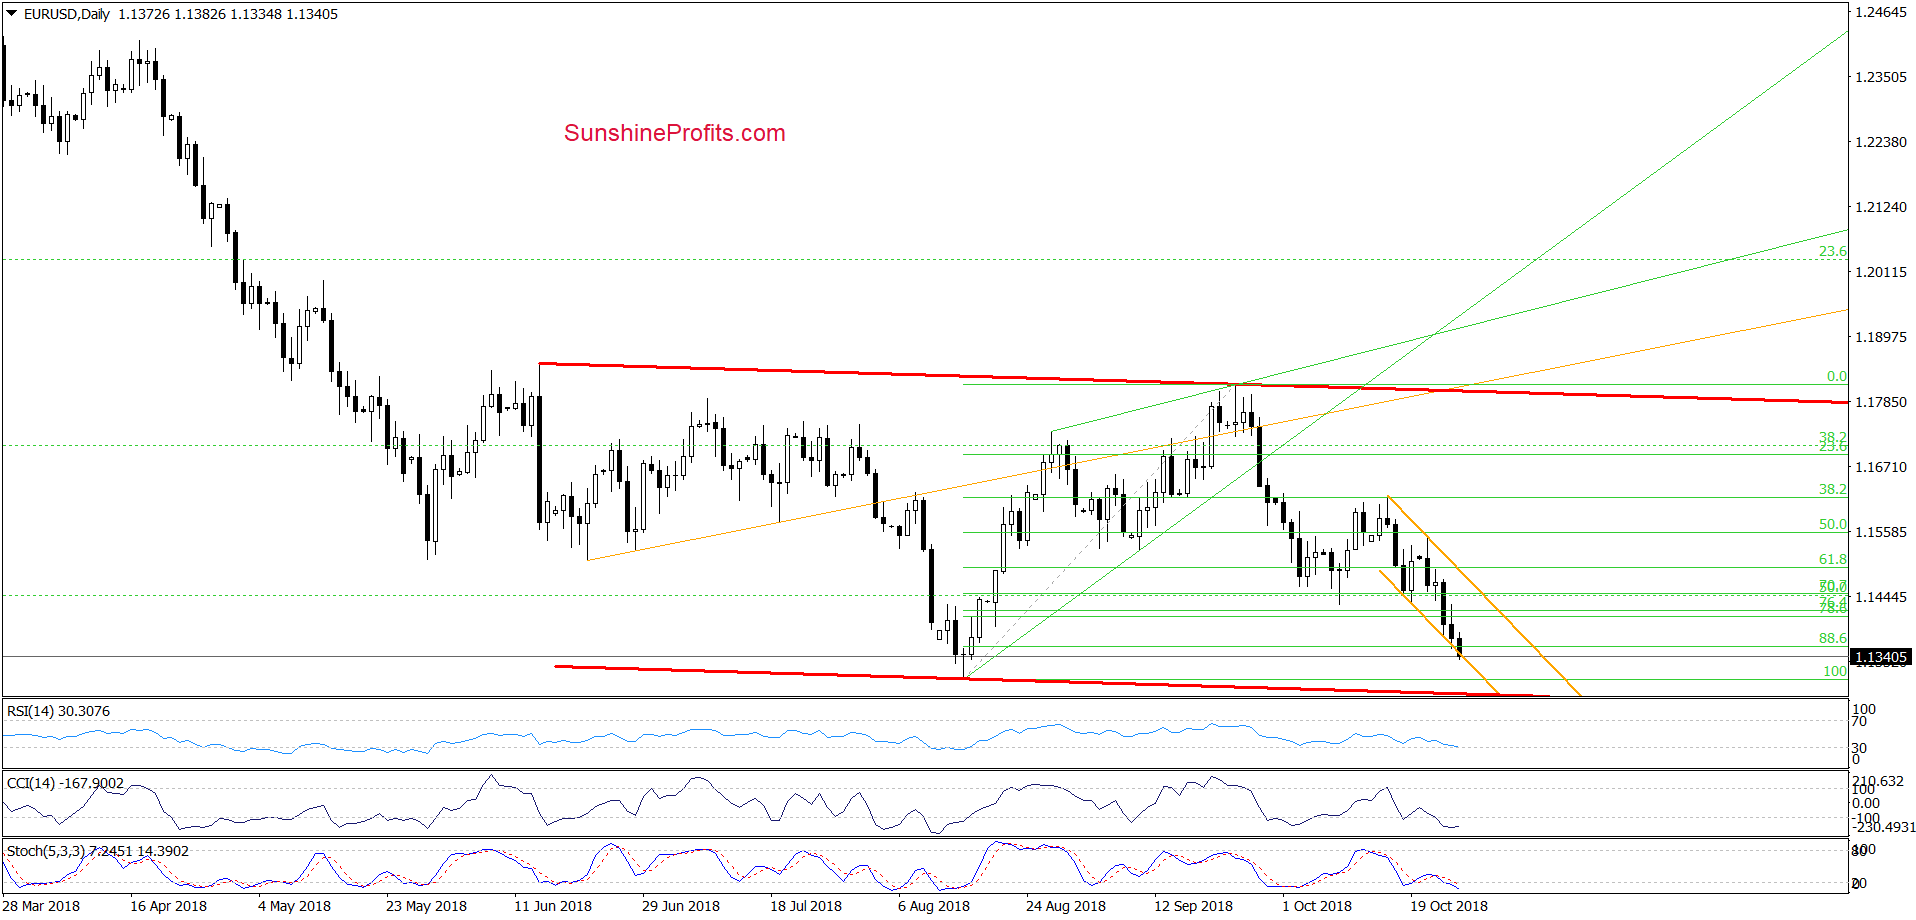
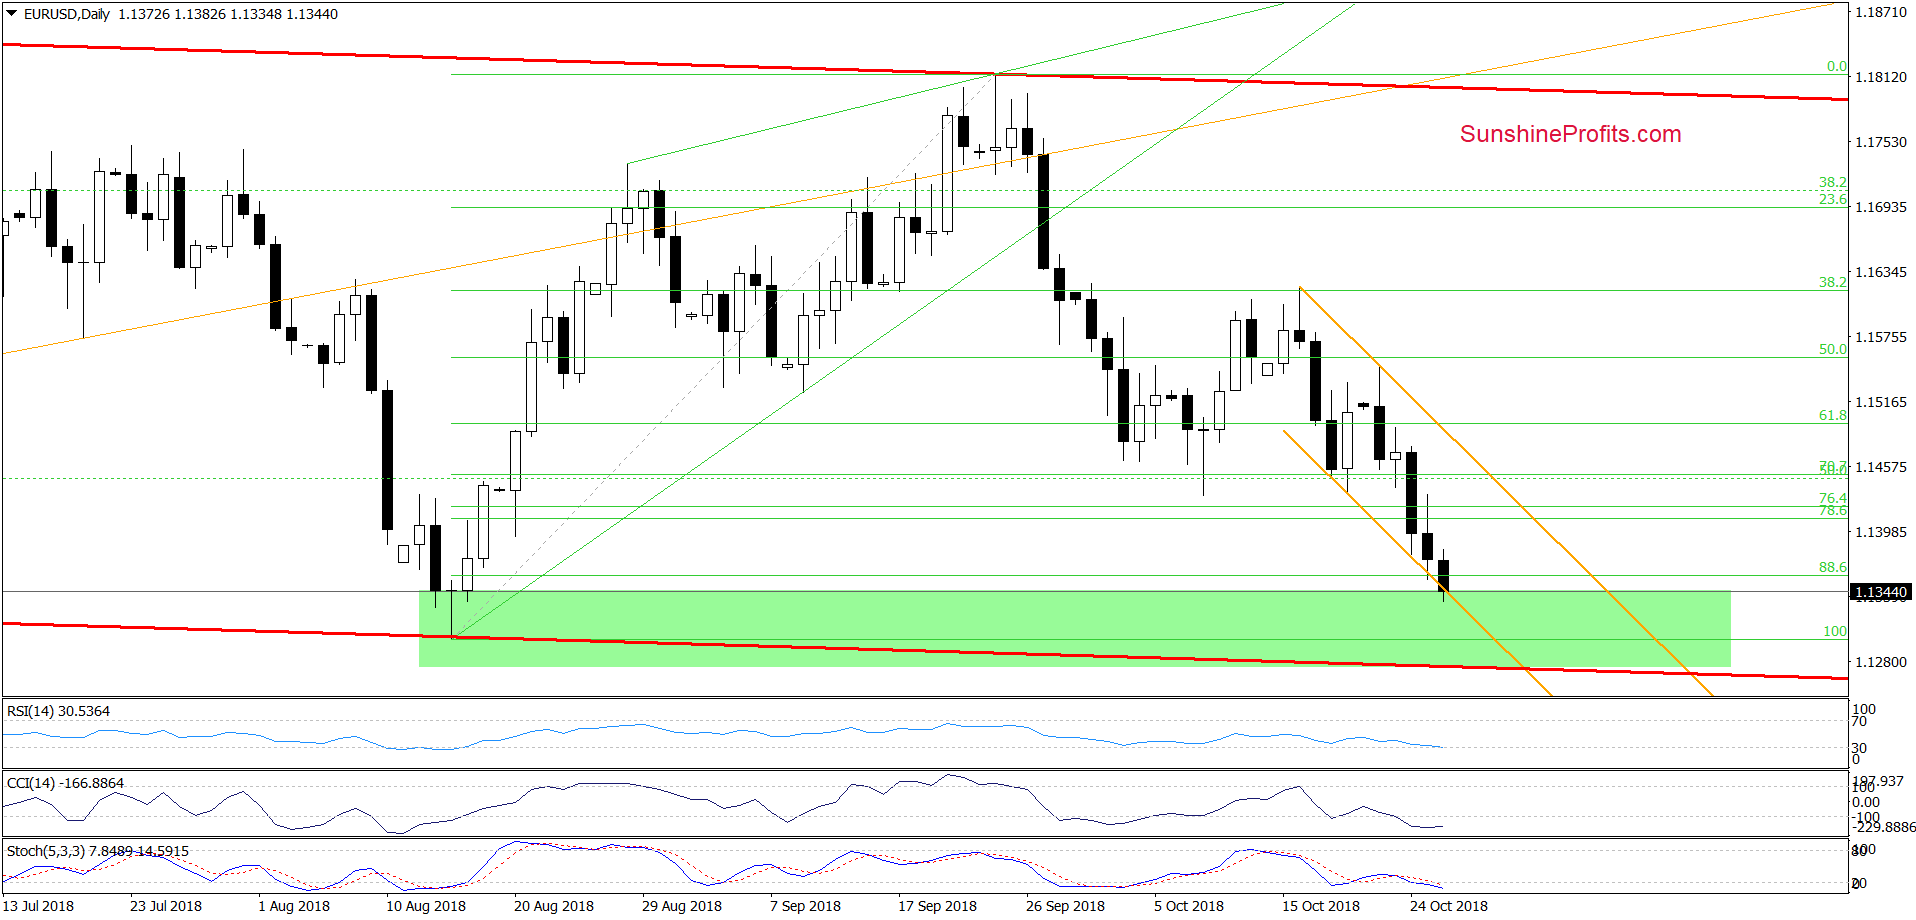
From Friday’s point of view, we see that currency bears pushed EUR/USD lower, which resulted in another test of the border of the very short-term orange declining trend channel.
Thanks to this drop, the pair also slipped to the green support zone based on August lows, which in combination with the lower border of the red declining trend channel (seen more clearly on the first daily chart) and the current position of the indicators suggests that the space for declines may be limited in the short term.
Nevertheless, if the exchange rate declines under the long-term red support line marked on the weekly chart below, the way to lower EUR/USD values will be open.
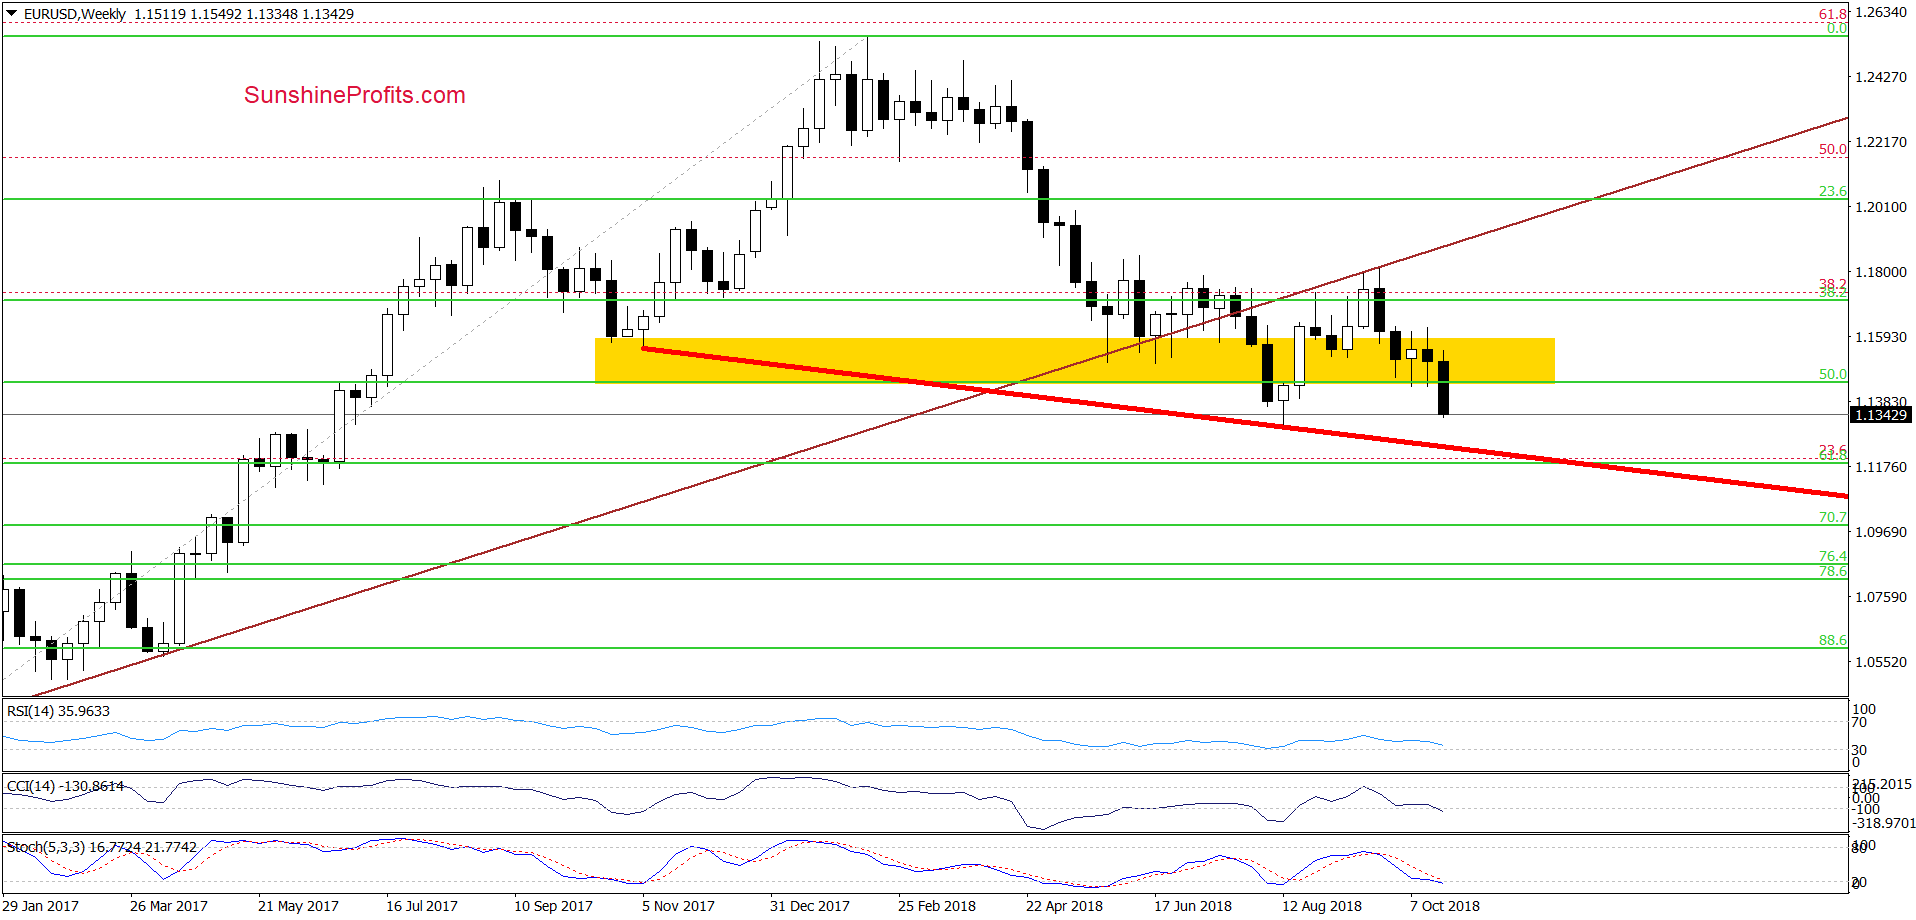
Why? Because the above-mentioned support line could be the neck line of the head and shoulders top formation, which increase its importance for both bulls and bears. We will keep our subscribers informed should anything change, or if we see a confirmation/invalidation of the above.
USD/JPY Re-Tests Short-Term Support
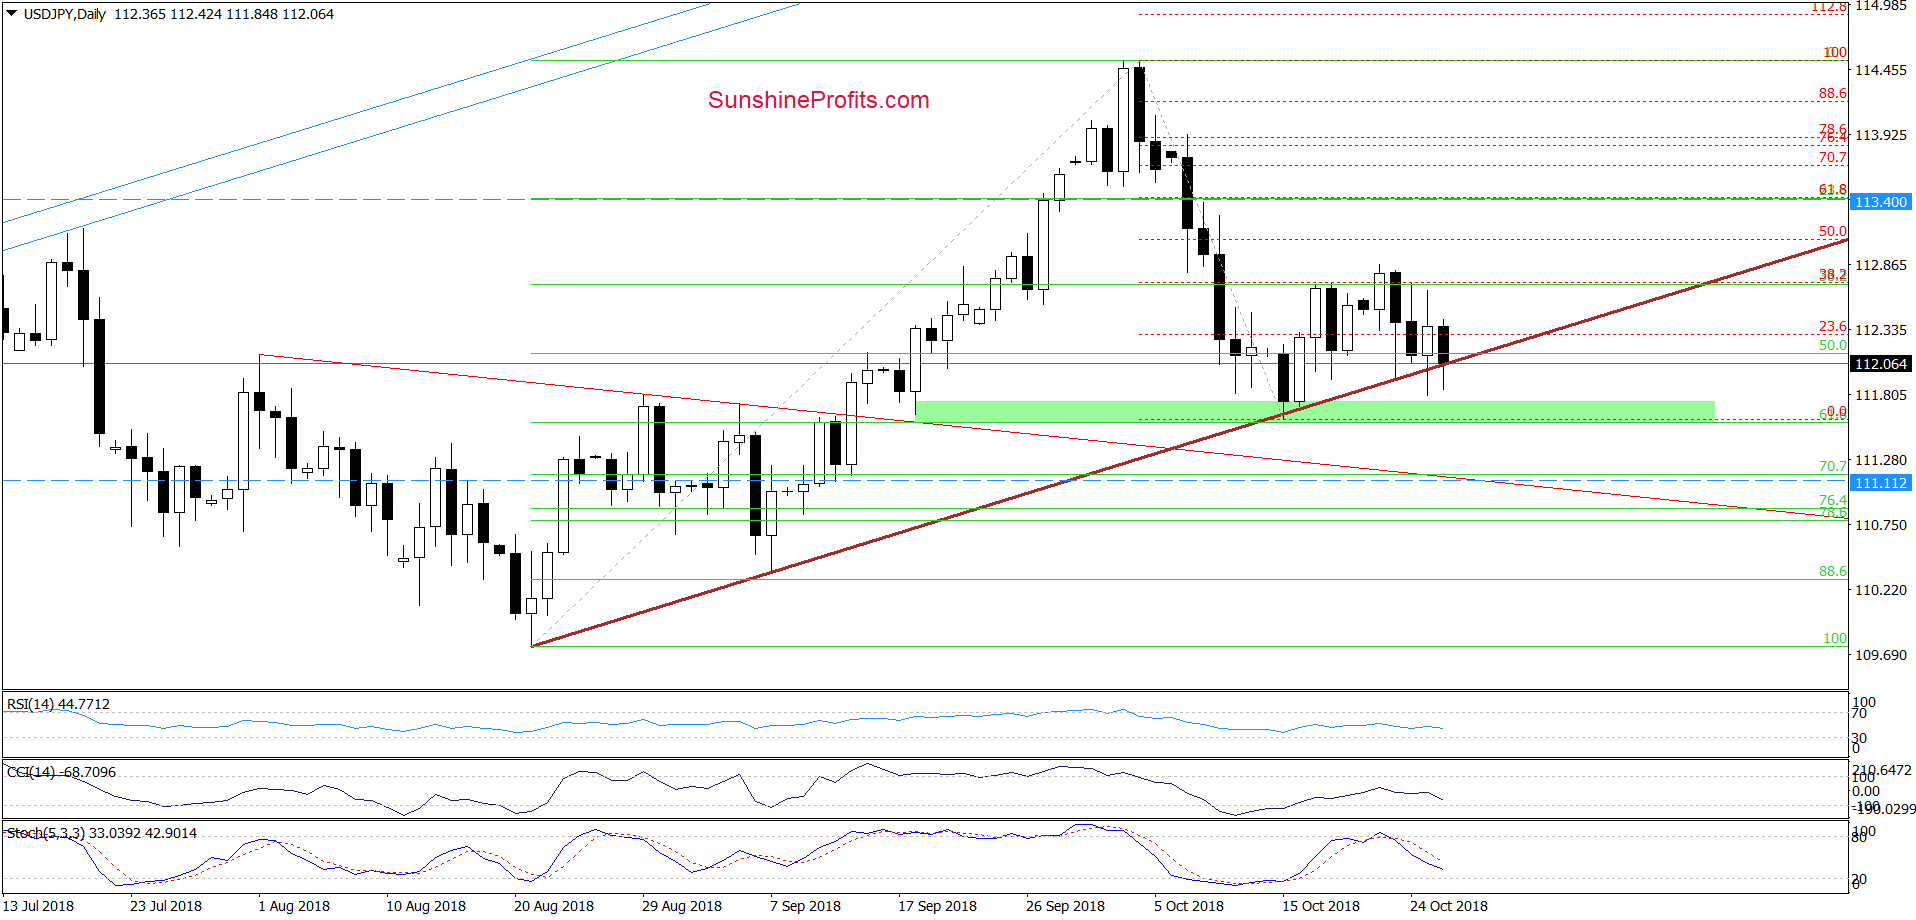
Looking at the daily chart, we see that USD/JPY declined in recent days, which resulted in a drop below the brown support line based on the August and September lows during Thursday’s session.
As you see, this deterioration was temporary and currency bulls took the pair higher in the following hours. Despite this rebound, their opponents triggered another move to the downside and the exchange rate re-tested the strength of the above-mentioned support on Friday.
Like we saw on Thursday, buyers pushed USD/JPY above the brown line, which suggests that further improvement may be just around the corner. If this is the case and the pair rebounds from here, we’ll see an increase to (at least) 113.40 in the coming week.
It is worth remembering that even the bears are trying to move north once again – the green zone based on the previous lows and the 61.8% Fibonacci retracement are not far from current levels, giving currency bulls another support and a reason to act.
Additionally, the blue support line based on March and August lows continues to keep declines in check, increasing the likelihood of another upswing at the beginning of the next week.
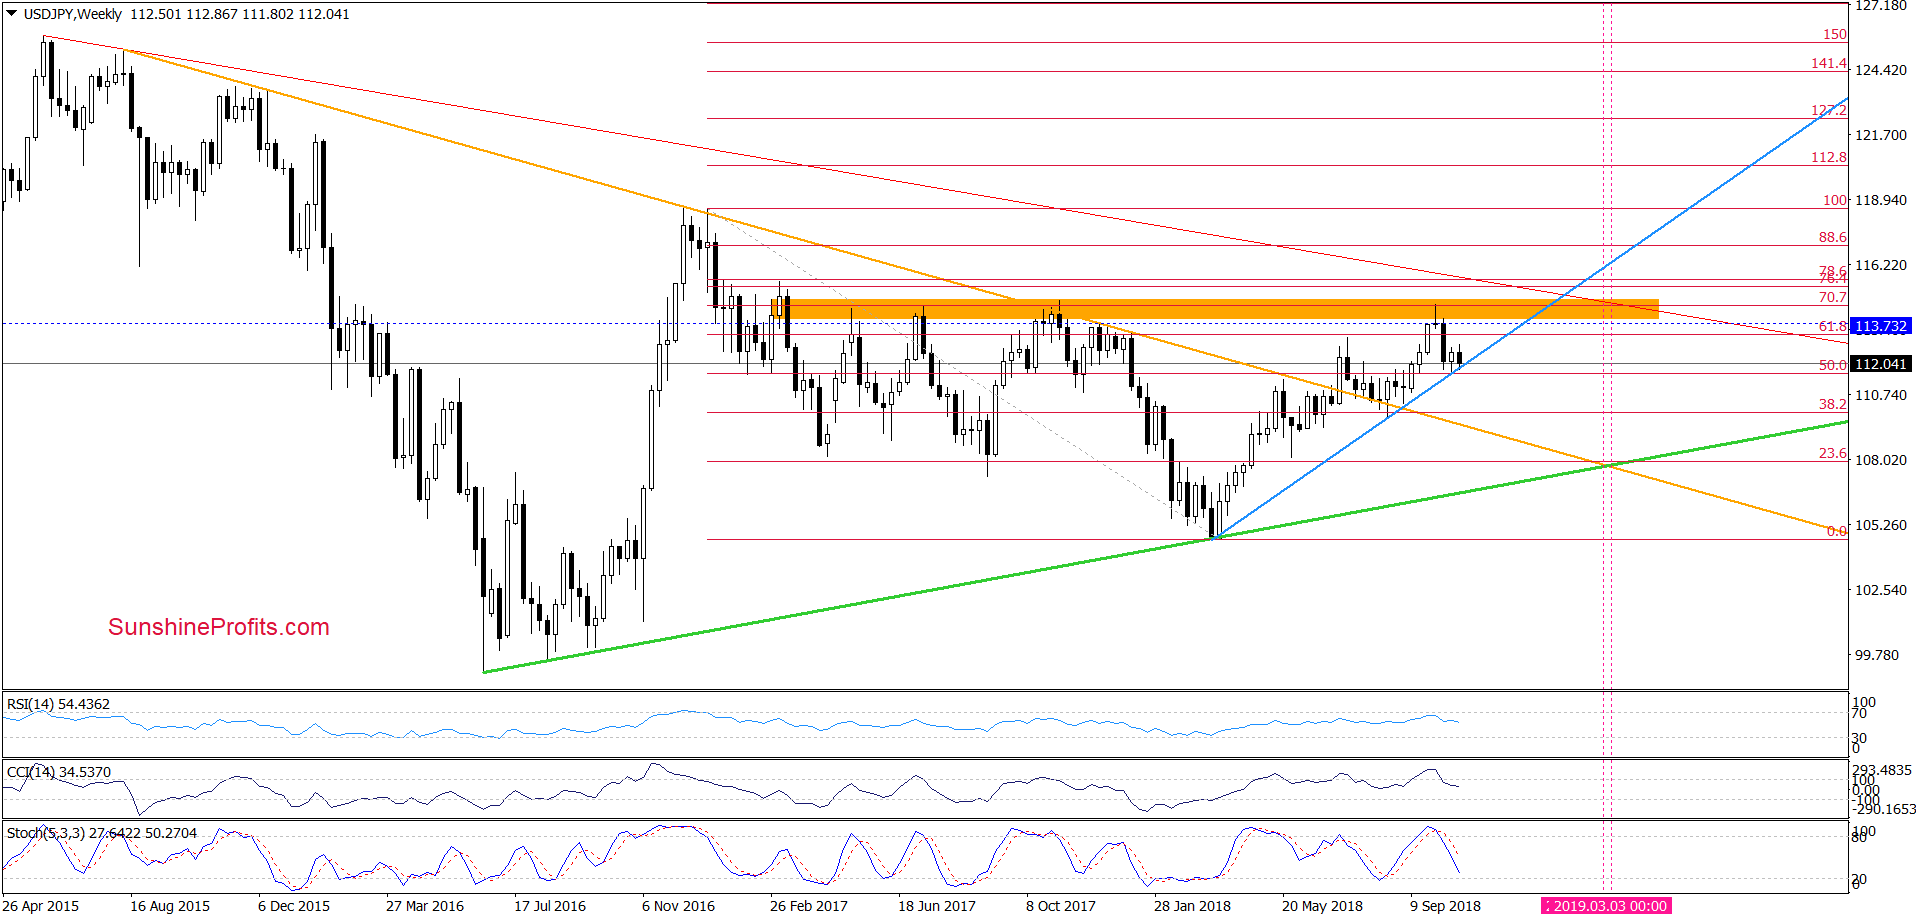
Trading position (short-term; our opinion): long positions with a stop-loss order at 111.11 and the initial upside target at 113.40 are justified from the risk/reward perspective.
AUD/USD And Rewarded Bears
Quoting our Forex Trading Alert posted on Oct. 17, 2018:
(…) the Stochastic Oscillator climbed to its overbought area and is very close to generate a sell signal, which increases the likelihood of another decline. If this is the case and we see such price action, AUD/USD will likely test the recent lows in the coming day(s).
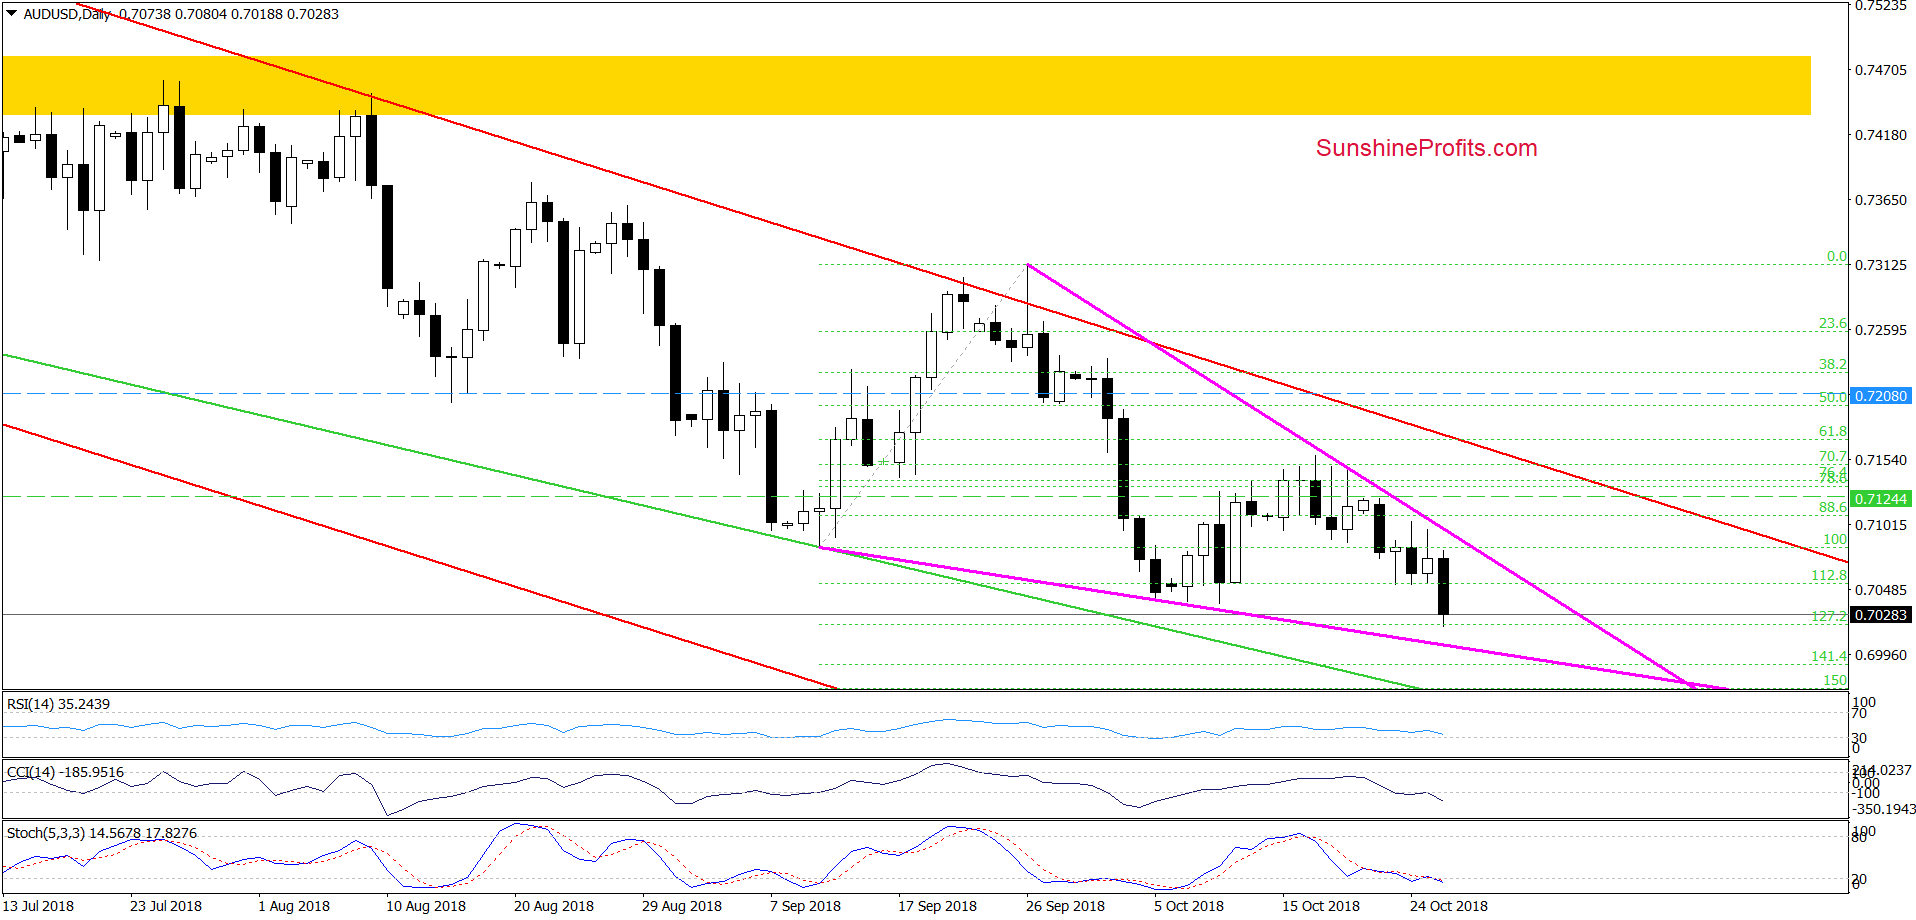
On the daily chart, we see that the situation developed in tune with the above scenario and currency bears not only tested, but also pushed AUD/USD to a fresh 2018 low.
Thanks to Friday’s decline, our short positions were closed with profits (as a reminder, we opened them when the pair was trading at around 0.7124).
What’s next for the exchange rate?
Looking at the daily chart, we see that AUD/USD remains inside the pink declining triangle, which suggests that the space for declines may be limited – especially when we factor in the current position of the daily indicators, the 127.2% Fibonacci extension and the proximity to the lower border of the formation.
Therefore, if currency bulls manage to invalidate the breakdown below the previous lows and the indicators generate buy signals, we’ll consider opening long positions. We will keep our subscribers informed should anything change, or if we see a confirmation/invalidation of the above.

