Investing.com’s stocks of the week
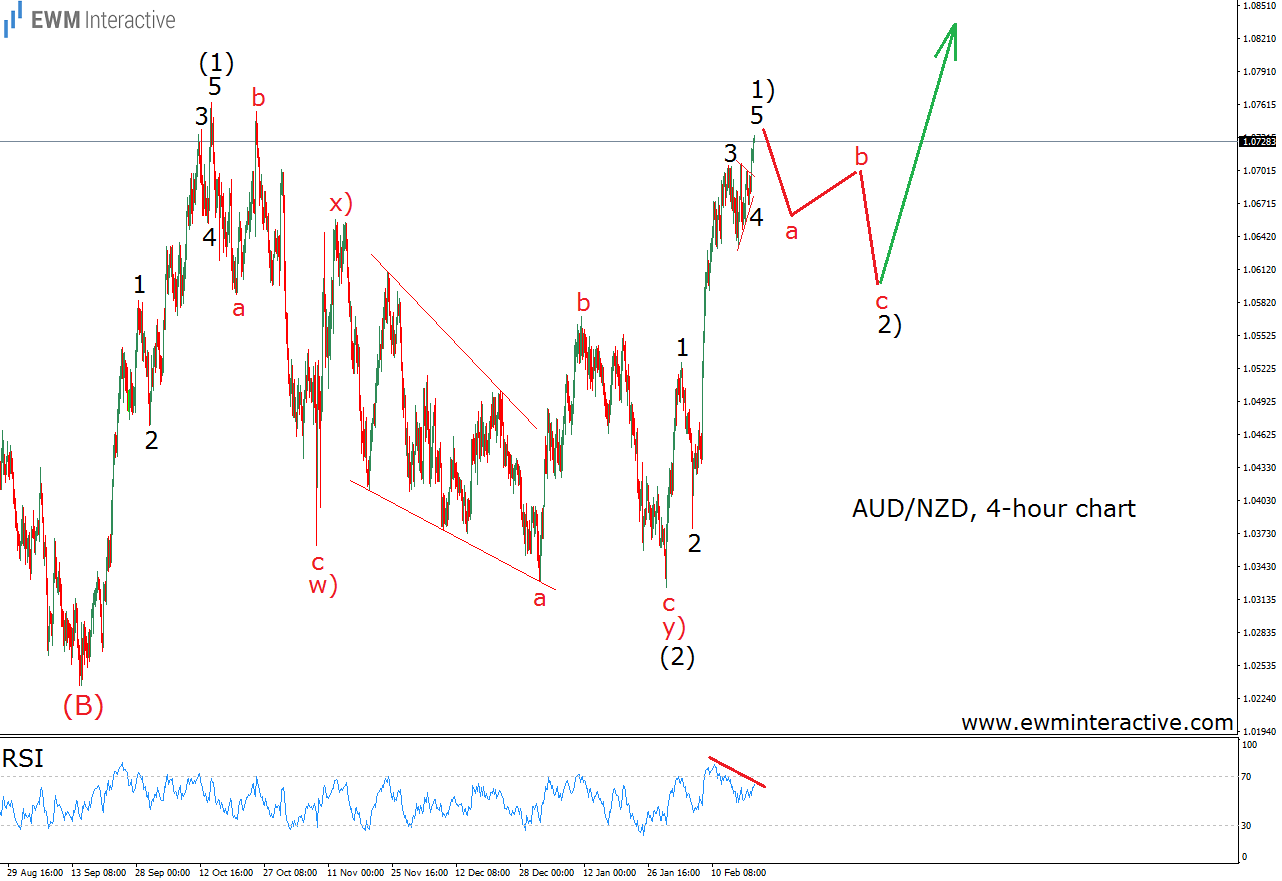
AUD/NZD was trading close to 1.0730 on February 21st, after a strong recovery from as low as 1.0324. Despite the speed and sharpness with which the pair was rising, the Elliott Wave Principle suggested the bears were likely to “drag the rate back down to the area near 1.0600, where new long opportunities should present themselves.” The chart below, included in our previous update on AUD/NZD, explains the logic behind that forecast.

The sharp and fast rally in question had a five-wave structure, indicating the trend was up. On the other hand, the theory states that every impulsive rally is followed by a three-wave decline. So, instead of joining the bulls near 1.0730, we thought a corrective pullback towards 1.0600 would offer better buying entries. Two and a half months later, we can now see what happened next.

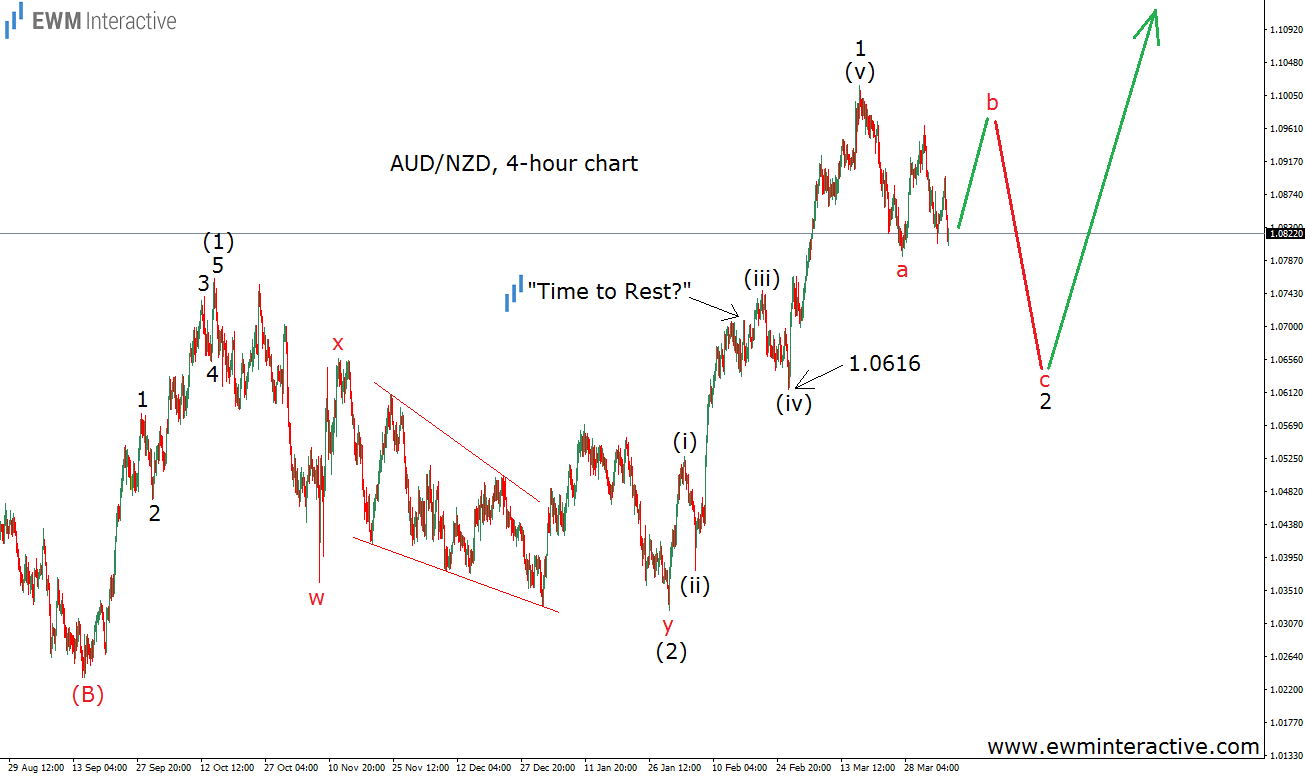
AUD/NZD fell to 1.0616... Okay, it is not an exact science. Soon after that, the bulls came back to lift the Australian dollar to 1.1018 against the New Zealand counterpart by March 16th. After a little relabeling, we see that the entire surge from 1.0324 to 1.1018 has the shape of a five-wave impulse in wave 1 with an extended fifth wave. This leads us to the present, where the exchange rate is hovering near 1.0820. The current weakness is supposed to be part of wave 2 of (3). Usually, extended fifth waves are fully retraced, before the trend resumes. Here, this means we could expect more downside from current levels, which should once again provide a better buying opportunity near the bottom of wave “c” of 2.
