AUD/NZD shot up sharply today, following a statement from the Reserve Bank of New Zealand that cemented the country’s interest rate at its current level for the foreseeable future. The pair was trading below the 1.1000 mark before the announcement, but rose to 1.1175 shortly after it.
However, if you have been following our publications for some time, you know that Elliott Wave analysis is our specialty. And Elliott Wave analysts do not regard news as the main engine behind market price movements. As the great Ralph Nelson Elliott once said, “at best, news is the tardy recognition of forces that have already been at work for some time and is startling only to those unaware of the trend.”
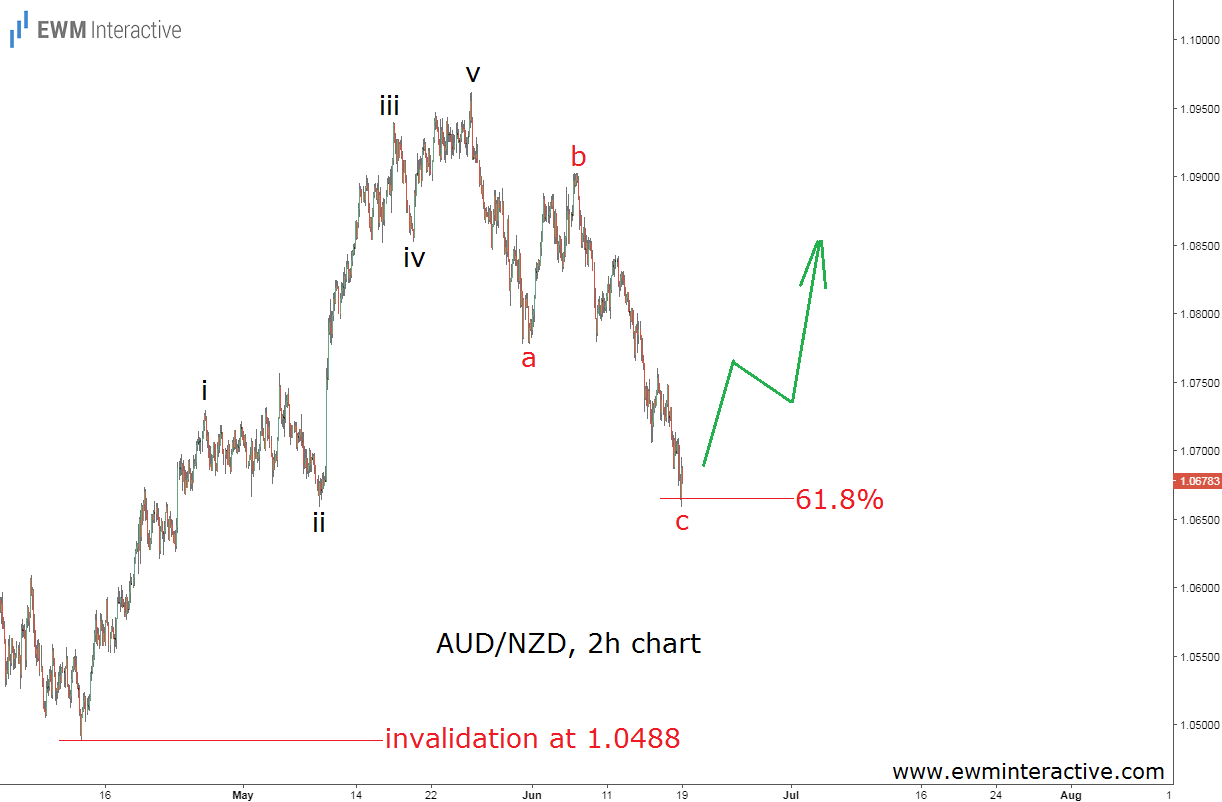
Was there an uptrend already in progress prior to RBNZ’s announcement then? Yes, there was, and the chart below, published in our last update on AUD/NZD on June 19th helped us identify it.

As visible, while the pair was hovering below 1.0680, the Wave principle suggested we should expect more strength in AUD/NZD. The logic behind our bullishness was simple. You find a five-wave impulse to the upside, followed by a three-wave correction in the opposite direction and – voila! – you have a textbook bullish setup in front of you.
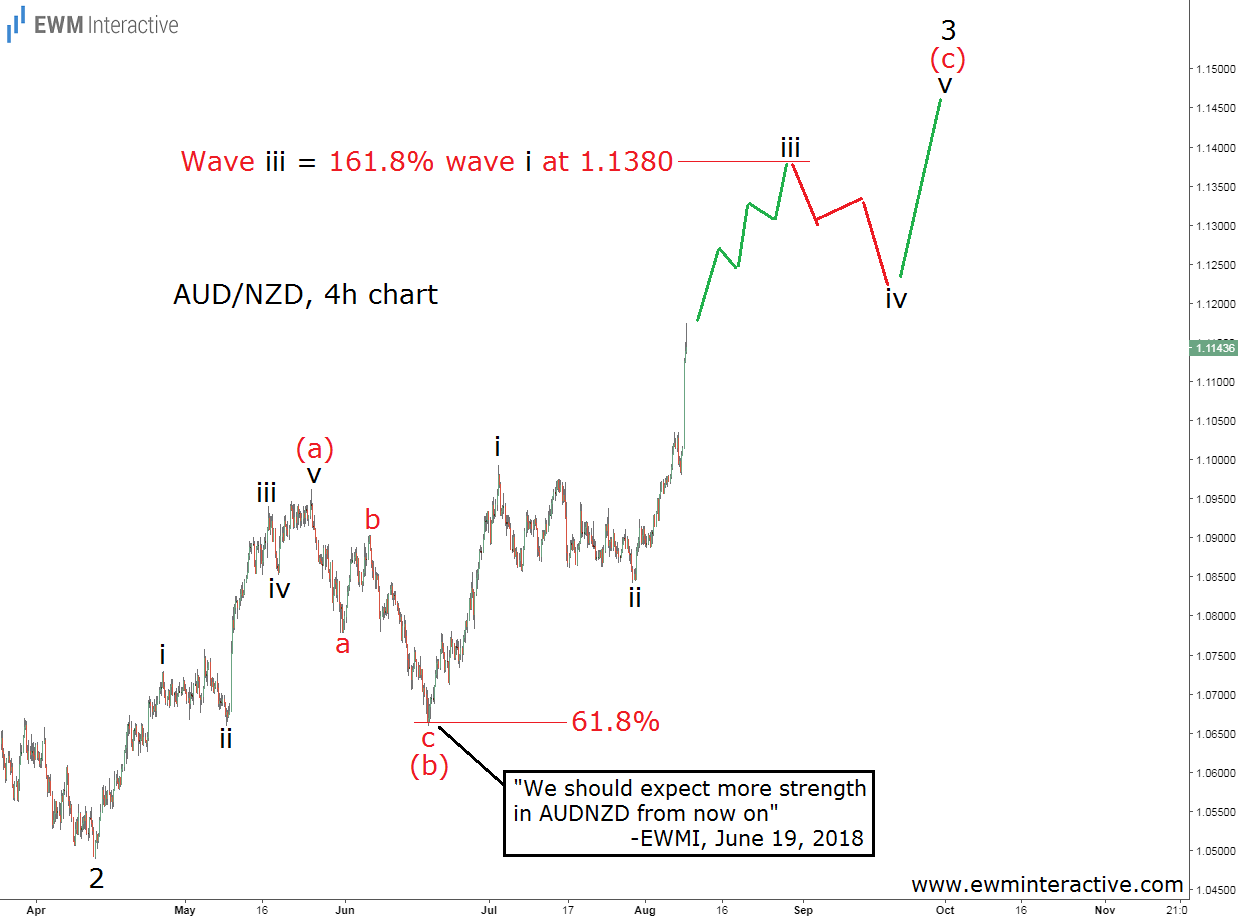
In AUD/NZD’s case above, the impulsive sequence was labeled i-ii-iii-iv-v, while the three-wave pullback looked like a simple a-b-c zigzag. Furthermore, wave “c” was touching the 61.8% Fibonacci support level, giving us another reason to prepare for a bullish reversal. Less than two months later today, here is an updated chart.

AUD/NZD started climbing right away. Today’s intraday high of 1.1175 means the bulls have lifted the pair by over 500 pips from the bottom at 1.0658. On top of that, the rally is still far from over. Since wave (a) was an impulse, wave (c) needs to be an impulse, as well. So far, it does not look like one. Third waves are usually 1.618 times longer than first waves. In order to achieve that feat, wave iii needs to reach 1.1380, before waves iv and v complete the pattern.
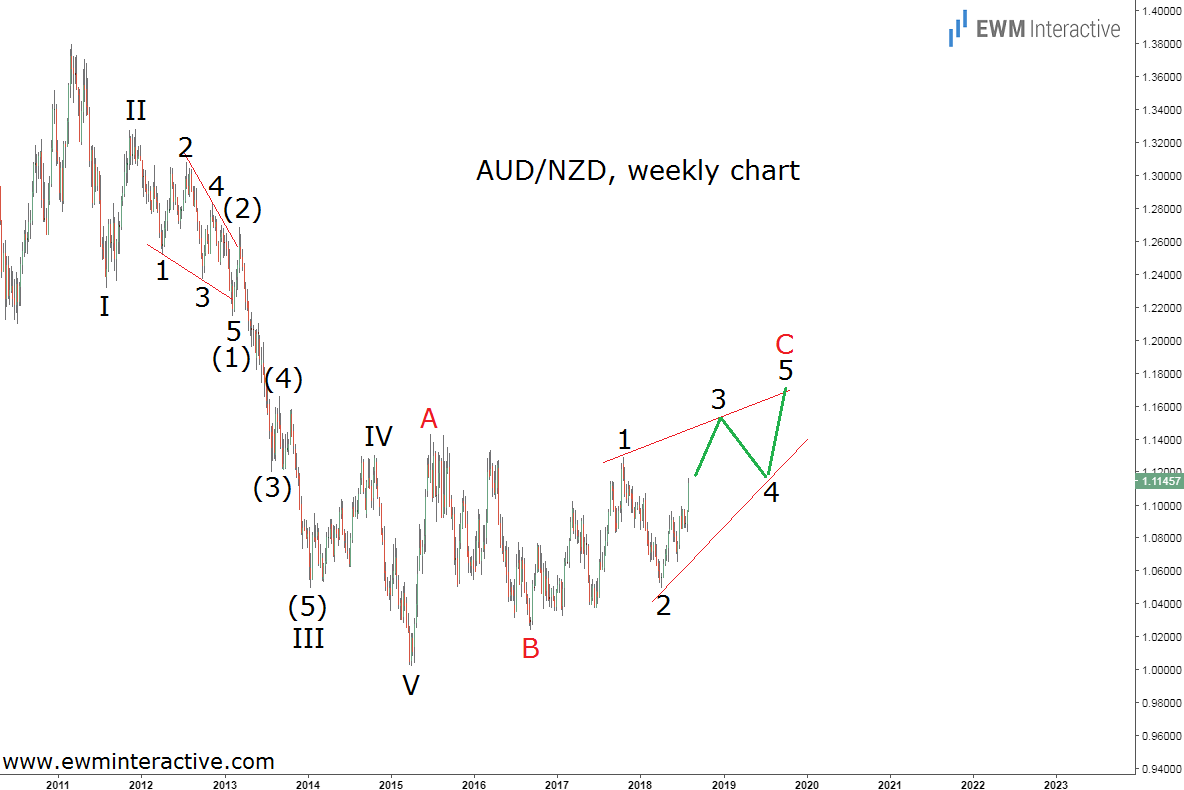
So far so good, but in Elliott Wave analysis no pattern develops in vacuum. Let’s take a look at the daily chart of AUD/NZD and see where does the recent price action fit into the bigger picture.

It appears today’s bounce is part of wave 3 of an ending diagonal wave C within a large A-B-C corrective recovery starting from 1.0021 in April, 2015. If this count is correct, wave 3 can be expected to visit the area between 1.1500 and 1.1600, before the bears return in wave 4. 1.1800 looks like a reasonable target for wave 5 of C.
In conclusion, the stage was set for a rally in AUD/NZD almost two months ahead of the RBNZ’s interest rate statement. Despite today’s surge, the bulls remain in charge with short-term targets in the vicinity of 1.1400. In the long run, 1.1800 is still up for grabs.
