Investing.com’s stocks of the week
Kiwi traders are gearing up for the results of this month’s RBNZ meeting, which will be released at 21:00 GMT (17:00 ET). As my colleague Chris Tedder noted, the market has completely priced in a rate cut, with some aggressive traders even placing bets that the central bank could opt for a “double” cut (50bps) as the NZ economy struggles to create growth amidst collapsing dairy prices.
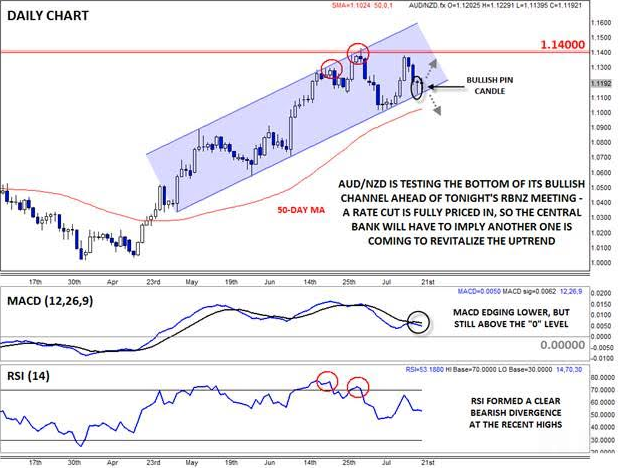
Of course, the central bank’s decision could have a big impact on the NZD/USD’s downtrend, but it is also worth watching AUD/NZD, which has seemingly stalled beneath key resistance at 1.1400 over the last month or so. The pair’s near-term rally put in a clear bearish RSI divergence near that resistance level at the start of the month and rates since failed at that barrier a second time last week, forming a potential double top pattern.
As it stands right now, the recent uptrend in AUD/NZD is under threat, but not broken. The pair is still holding above its 2.5-month bullish trend line, as well as the 50-day moving average. And while the MACD is edging lower, it’s still above the “0” level that indicates generally positive momentum (in other words, the 12-day moving average is still above the 26 day). More immediately, Tuesday’s price action formed a daily Bullish Pin Candle*, or hammer, which shows an intraday shift from selling to buying pressure, though the upcoming RBNZ meeting may overwhelm this near-term bullish technical sign.
The technical setup presents a possible binary outcome to Wednesday’s RBNZ meeting -- if the central bank cuts interest rates and tries to talk the currency down by implying at least one more rate cut later this year, AUD/NZD could bounce off support and make another run toward the 1.1400. On the other hand, if the RBNZ shifts back to a neutral outlook after the (presumed) cut, the kiwi could catch a bid and AUD/NZD could drop toward 1.10 next. Of course, in the unlikely scenario that the central bank remains on hold, the kiwi could explode higher against all of its major rivals.
*A Bullish Pin (Pinnochio) candle, also known as a hammer or paper umbrella, is formed when prices fall within the candle before buyers step in and push prices back up to close near the open. It suggests the potential for a bullish continuation if the high of the candle is broken.

Source: FOREX.com
