Investing.com’s stocks of the week
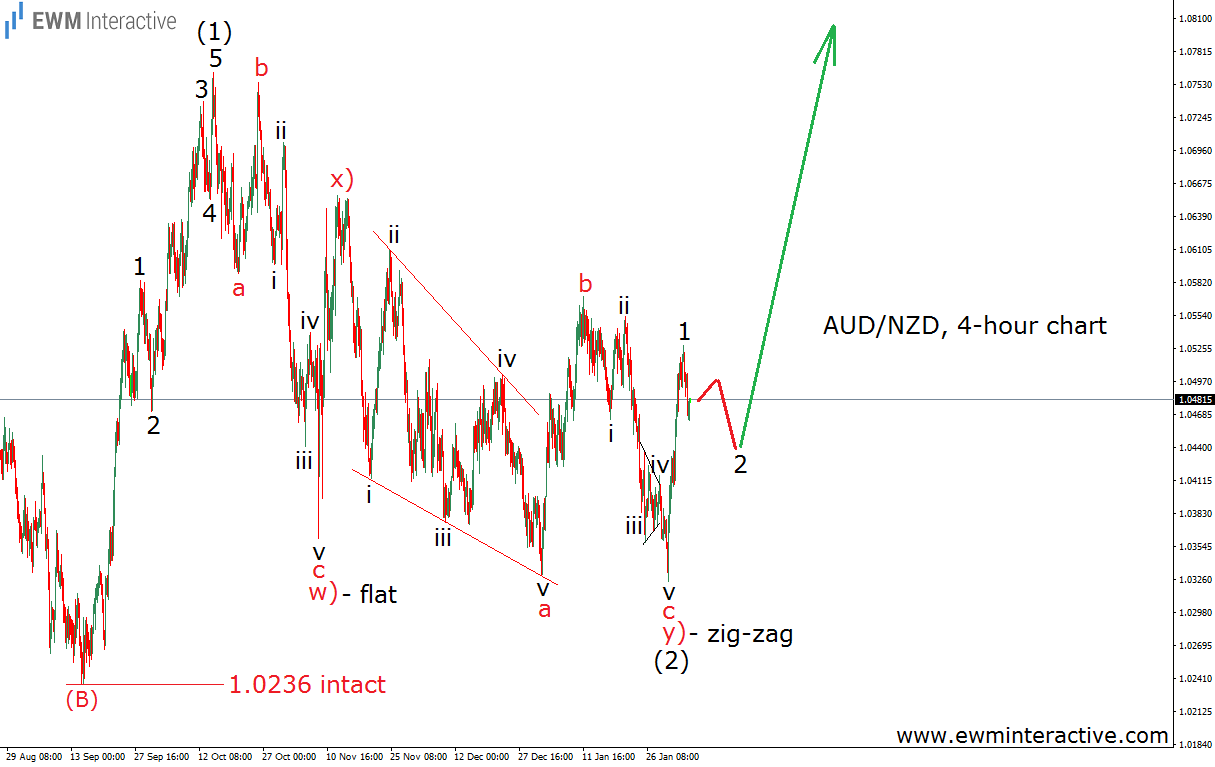
It has been just 15 days since the last time we wrote about AUD/NZD. On February 6th, the pair was trading around 1.0480, but we thought it was unlikely to remain there for long, because, as the chart below will show, our Elliott Wave analysis pointed much higher.
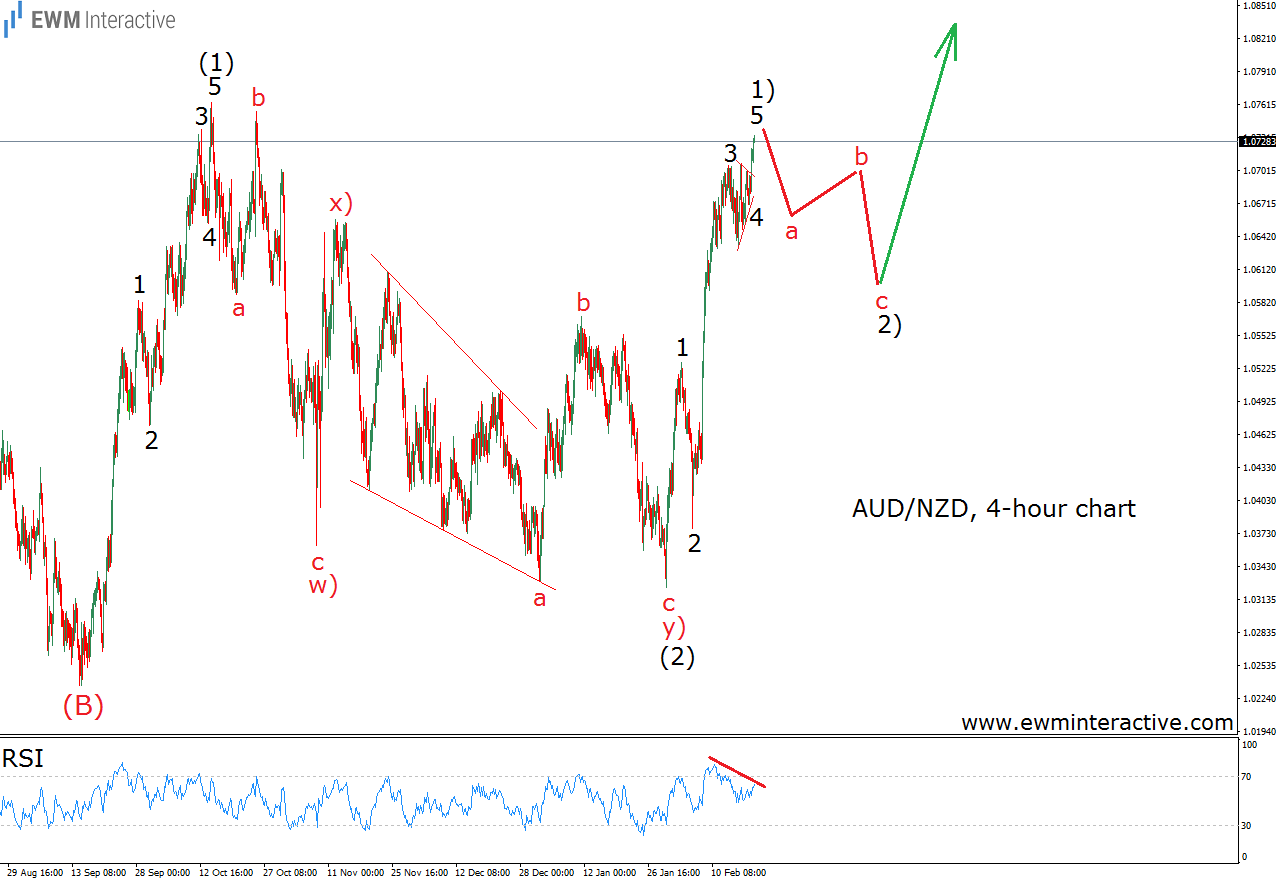
As visible, the 4-hour chart of AUD/NZD allowed us to recognize a five-wave impulse between 1.0236 and 1.0763 in wave (1), which was followed by a corrective combination in wave (2). Therefore, the 5-3 wave cycle seemed complete and the trend was supposed to resume in the direction of the impulsive sequence – to the upside. The Australian dollar just rose to 1.0735 against its New Zealand rival and this could be a good time for an update.
It turns out that a new impulse has emerged from the bottom of wave (2) at 1.0324. This means two things. First, the uptrend is still intact and higher level should be expected. And second, before the rally continues, we should wait for a three-wave decline in wave 2), because a correction comes after every impulse. Also, the relative strength index seems to be confirming the short-term bearish outlook by showing a divergence between waves 3 and 5 of 1). In other words, those who have been riding the pair’s phenomenal surge in the last two weeks, might want to catch a break and wait for the bears to drag the rate back down to the area near 1.0600, where new long opportunities should present themselves.
