AUD/JPY Reflects Market Jitters

Published 09/27/2018, 06:07 AM
Updated 07/09/2023, 06:31 AM
EUR/USD
-
AUD/JPY
-
IT10YT=RR
-

AUD/JPY Daily Chart

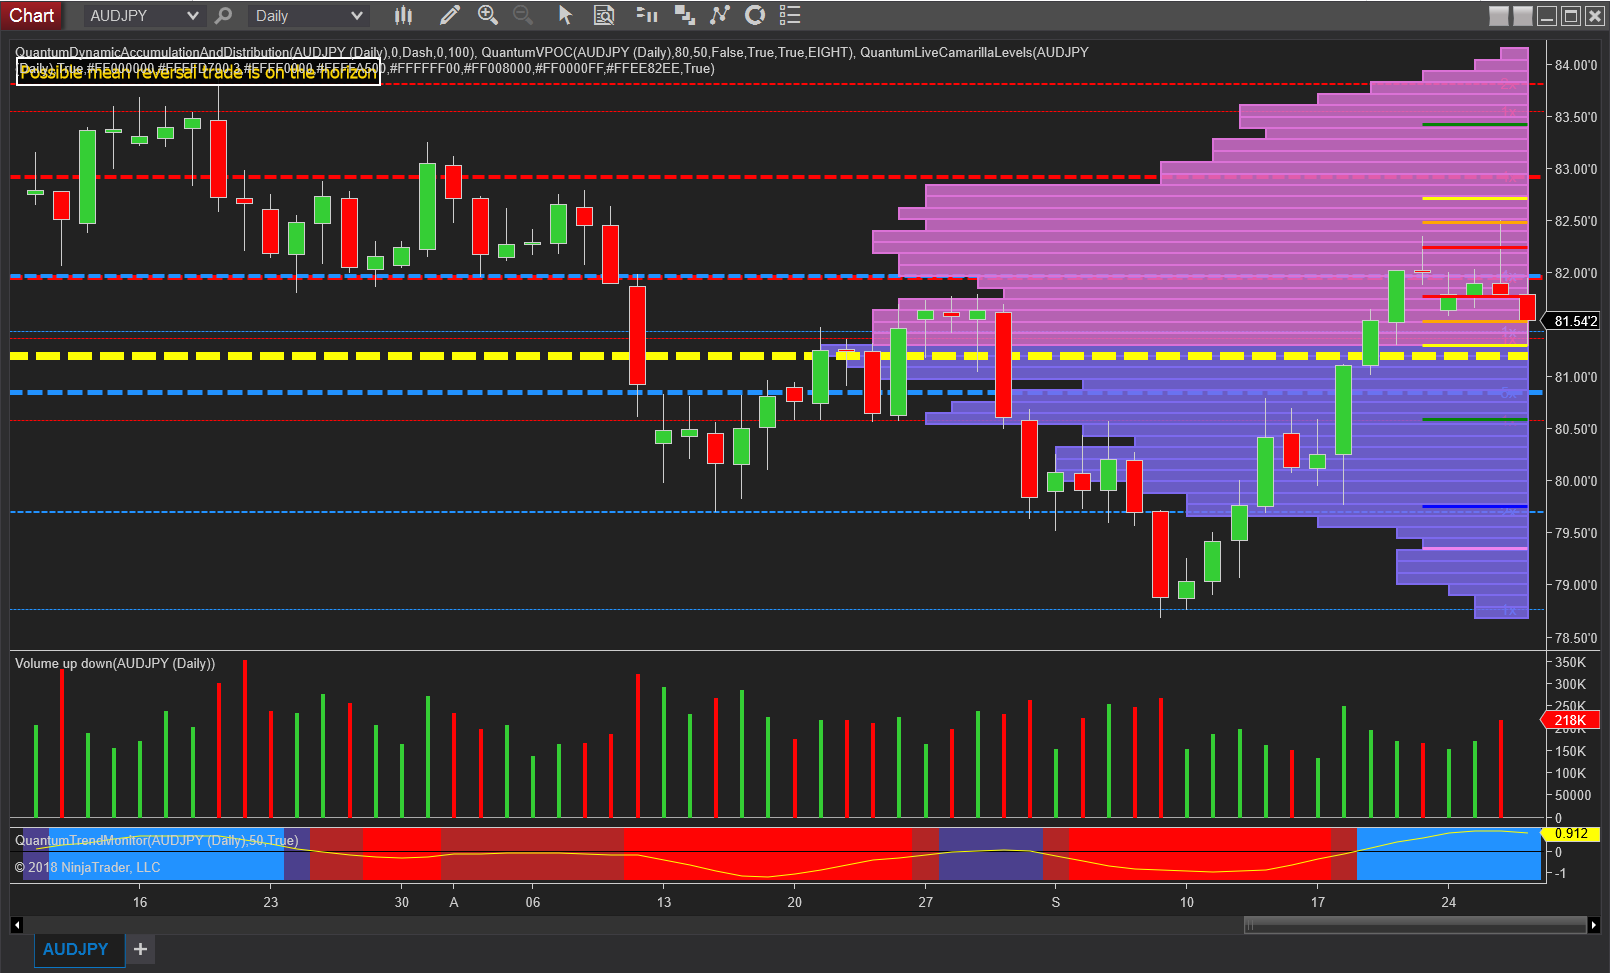
The AUD/JPY is often used as a proxy for market sentiment and risk. In other words when the pair rises markets are seen as benign with traders and investors prepared to take on more risk, but the daily chart for the pair does not inspire great confidence, and the reasons are as follows.

Over the past few sessions we have seen rising prices accompanied by falling volume, which is a classic VPA anomaly. Moreoever, this has since been followed by several days where the pair has attempted to rally but then closed near the open, which again is a bearish signal. And this has been duly confirmed in this morning’s trading session with the pair moving back to test the volume point of control which sits in the 81.20 region.

This morning’s market jitters have also been ascribed to the Italian government wanting to increase the country’s budget deficit to 2.4% of GDP as opposed to 2% which, according to Bank of America is seen as a ‘watershed level’. As a result Italian bank shares have fallen and euro followed suit, although it has since recovered some poise. Italian bond yields also spiked higher. And following on from yesterday’s FOMC and the Fed's projection of increasing interest rate rises in 2019 will also add to today’s somewhat downbeat mood.

Latest comments

Loading next article…
Risk Disclosure: Trading in financial instruments and/or cryptocurrencies involves high risks including the risk of losing some, or all, of your investment amount, and may not be suitable for all investors. Prices of cryptocurrencies are extremely volatile and may be affected by external factors such as financial, regulatory or political events. Trading on margin increases the financial risks.
Before deciding to trade in financial instrument or cryptocurrencies you should be fully informed of the risks and costs associated with trading the financial markets, carefully consider your investment objectives, level of experience, and risk appetite, and seek professional advice where needed.
Fusion Media would like to remind you that the data contained in this website is not necessarily real-time nor accurate. The data and prices on the website are not necessarily provided by any market or exchange, but may be provided by market makers, and so prices may not be accurate and may differ from the actual price at any given market, meaning prices are indicative and not appropriate for trading purposes. Fusion Media and any provider of the data contained in this website will not accept liability for any loss or damage as a result of your trading, or your reliance on the information contained within this website.
It is prohibited to use, store, reproduce, display, modify, transmit or distribute the data contained in this website without the explicit prior written permission of Fusion Media and/or the data provider. All intellectual property rights are reserved by the providers and/or the exchange providing the data contained in this website.
Fusion Media may be compensated by the advertisers that appear on the website, based on your interaction with the advertisements or advertisers.
© 2007-2025 - Fusion Media Limited. All Rights Reserved.