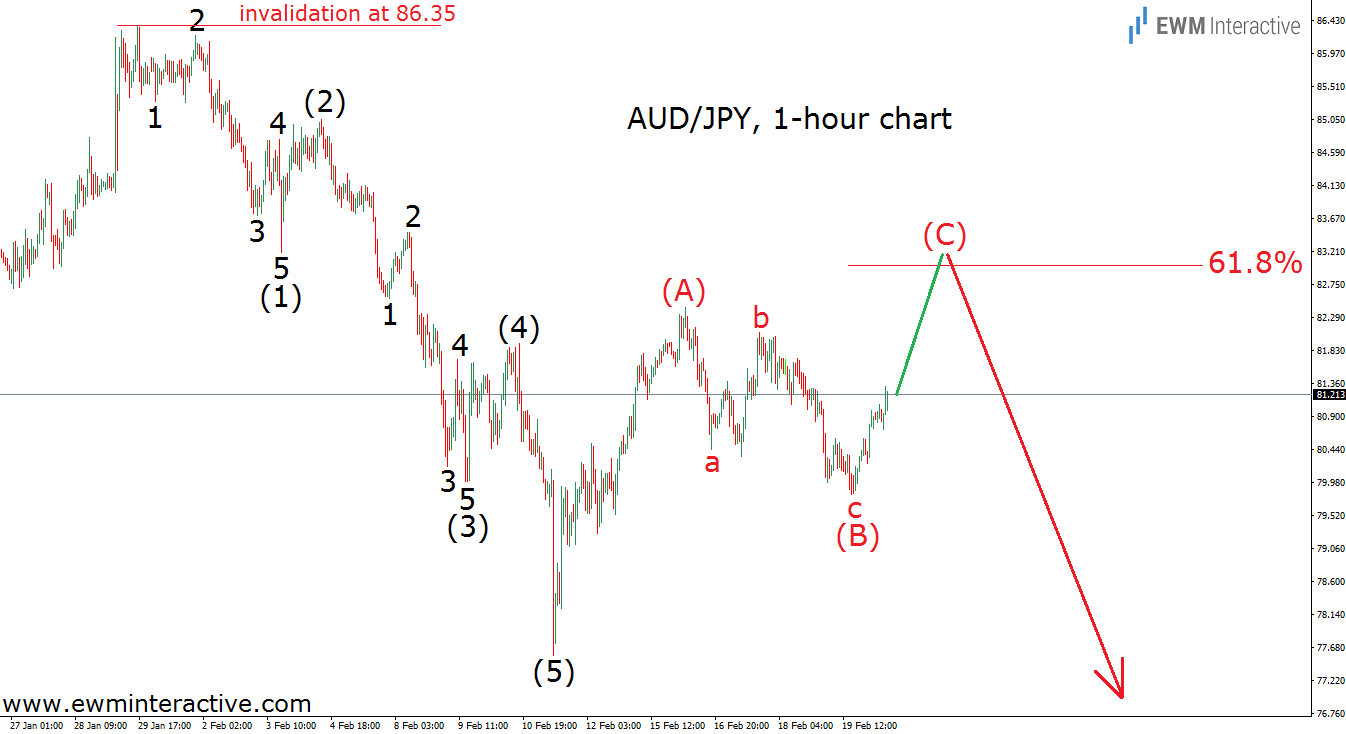
AUD/JPY, currently trading around 81.25, has been rising since February 11th, when the pair touched 77.58. What should we be thinking about this recovery and how high could we expect it to travel? In order to be able to answer this question, we will apply the Elliott Wave Principle to the hourly chart of AUD/JPY, where we can see not only the recent rally, but the preceding decline as well. By the way, its wave structure is far more important. See it below.
The wave structure of the sell-off between 86.35 and 77.58 is as visible as an impulse can get. In addition, the sub-waves of waves (1) and (3) are also pretty obvious. According to the theory, every such impulse is followed by a three-wave correction in the opposite direction. In our opinion, that is exactly what has been developing since February 11th. We believe an (A)-(B)-(C) zig-zag to the north is now under construction. Its wave (C) still has room to grow, probably to the 61.8% Fibonacci level, which is supposed to provide strong resistance. In other words, the area near 83.00 is where the bears should return, since the whole 5-3 wave cycle would be complete. As long as the invalidation level at 86.35 holds, AUD/JPY is likely to weaken towards 77.50 or lower.
