The trend is your friend” is one of the first market witticisms most new traders learn, with good reason: After all, buying pullbacks or breakouts in established uptrends and downtrends is the essence of many of the world’s most successful trading strategies. While those strategies can be successful in markets that are showing traditional uptrends or downtrends, the phrase provides little guidance for what traders should do in instances when there isn’t an obvious uptrend or downtrend, at least at first glance.
At a very high level, the essence of the saying “the trend is your friend” is that you should give the established trend the benefit of the doubt until you see convincing evidence that its changed. This principle can be applied to uptrends (higher highs and higher lows), downtrends (lower highs and lower lows), and even sideways trends (similar highs and similar lows).
AUD/JPY: A case study in rangebound trading
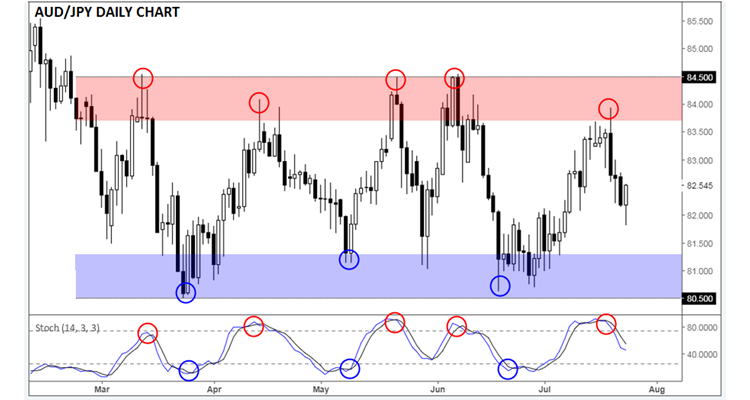
AUD/JPY’s price action over the last five months provides a picture-perfect case study of rangebound trading opportunities. Like many so-called “risk assets,” the pair peaked in January of this year before trending low through February and March. In March, the pair put in a high around 84.50 and 80.50, keeping the established downtrend intact. However, rates proceeded to put in similar highs and lows in mid-April and early May respectively, suggesting that the trend had shifted from a downtrend to a sideways trend.
At that point, astute traders could look to shift to more of a “sideways trend” trading mindset. In sideways trends, overbought/oversold oscillators are often used in concert with resistance/support levels to identify areas to sell/buy. As the chart below shows, a trader could have looked to sell when the stochastics oscillator reached overbought territory (above 75-80) while price was testing the top of its range (83.75-84.00) and looked to buy when the stochastics was oversold (below 25-30) and price was testing the bottom of its range (80.50-81.25):

Disclaimer: The information on this web site is not targeted at the general public of any particular country. It is not intended for distribution to residents in any country where such distribution or use would contravene any local law or regulatory requirement. The information and opinions in this report are for general information use only and are not intended as an offer or solicitation with respect to the purchase or sale of any currency or CFD contract. All opinions and information contained in this report are subject to change without notice. This report has been prepared without regard to the specific investment objectives, financial situation and needs of any particular recipient. Any references to historical price movements or levels is informational based on our analysis and we do not represent or warranty that any such movements or levels are likely to reoccur in the future. While the information contained herein was obtained from sources believed to be reliable, author does not guarantee its accuracy or completeness, nor does author assume any liability for any direct, indirect or consequential loss that may result from the reliance by any person upon any such information or opinions.
