Investing.com’s stocks of the week
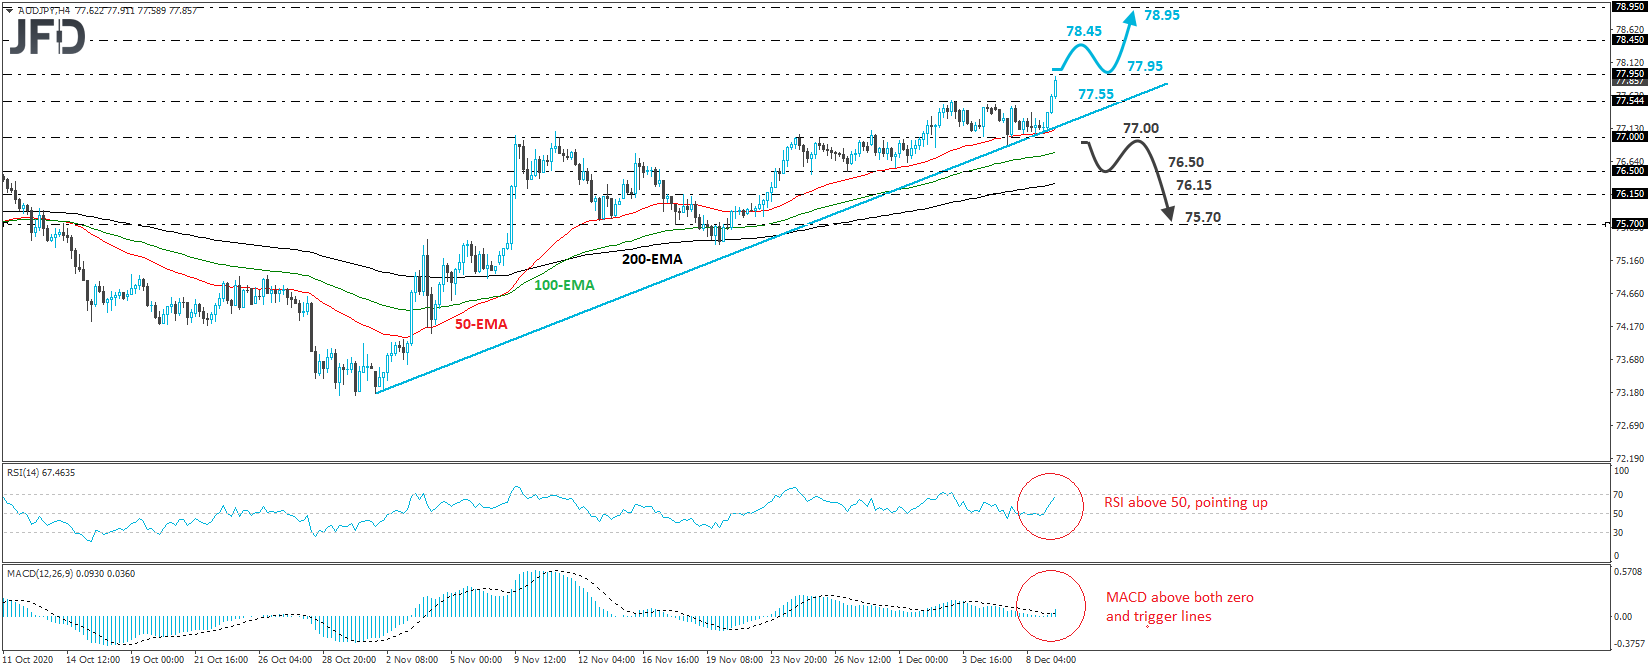
AUD/JPY edged north on Wednesday, after hitting support near the crossroads of the 77.00 level and the tentative upside support line drawn from the low of Nov. 1. The rally also took the rate above the key resistance of 77.55, which stopped the bulls from pushing higher on Dec. 3, thereby confirming a forthcoming higher high on both the daily and 4-hour charts. Thus, bearing in mind all these technical signs, we will hold a positive stance over the short-term outlook.
At the time of writing, AUD/JPY looks to be approaching the 77.95 territory, which is defined as a resistance by the high of Sept. 3. A break above that zone may invite more bulls into the action and perhaps allow advances towards the peak of Aug. 31, at around 78.45. If that area is not able to stop the rise, then we may experience extension towards the 78.95 territory, marked by the high of Apr. 29, 2019.
Shifting attention to our short-term oscillators, we see that the RSI rebounded from near its 50 line and now looks to be heading towards 70, while the MACD lies above both its zero and trigger lines, pointing up as well. Both indicators detect increasing upside momentum and support the notion for further advances in this exchange rate.
On the downside, we would like to see a clear dip below 77.00 before we start examining a trend reversal. This would not only take the rate below the aforementioned upside line, but it would also confirm a forthcoming lower low. The bears may then get encouraged to drive the battle towards the 76.50 zone, which provided strong support between Nov. 25 and 30, the break of which may allow extensions towards the inside swing high of Nov. 18, at 76.15. If that zone is violated as well, then the next stop may be near 75.70, which is the low of the same day.
