Street Calls of the Week

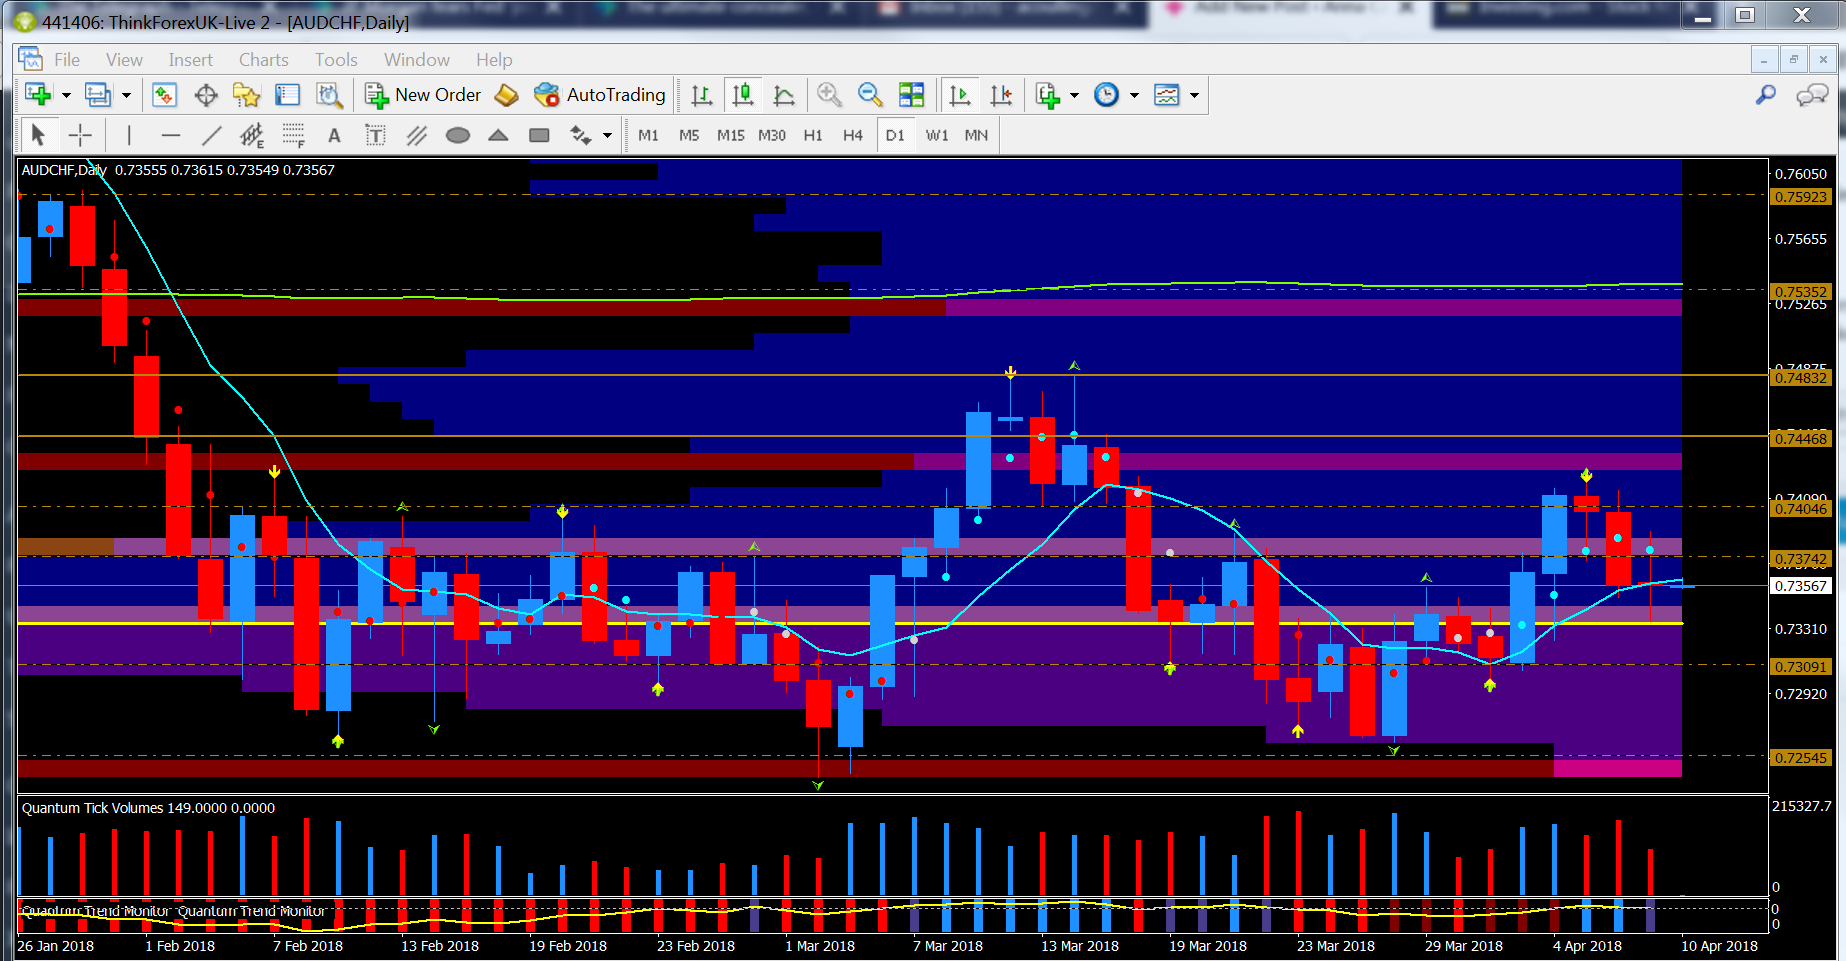
Yesterday was remarkably lively and I wanted to find a chart that not only reflected this, but also captured the indecision and uncertainty that lies behind the current price action. The chart that best reflects this mood is the daily AUD/CHF.
It's a pair where on one side we have a currency that represents risk-on sentiment (the Aussie) paired with one (Swiss franc) that attracts huge flows whenever the market is assailed by fear and panic. As we can see from the daily chart, yesterday’s candle closed as a classic long leg doji on reasonable volume. What this candle is signaling is the current market indecision as traders and investors try to make sense not only of ongoing geopolitical events that range from trade wars to unrest in the Middle East but also conflicting economic data.
Whilst the long leg doji is clearly a candle of indecision, it also reflects the intraday opportunities for speculative traders where price action can best be described as ‘good two way.’ It also reminds us that opportunities in the current volatile market should be grabbed and banked with longer term trading put on hold for the time being, at least until market conditions settle and more established trends develop.
At present it is a pure traders’ market, and generally not one for buy and hold. We could say ‘smash and grab’ is now very much the order of the day.
