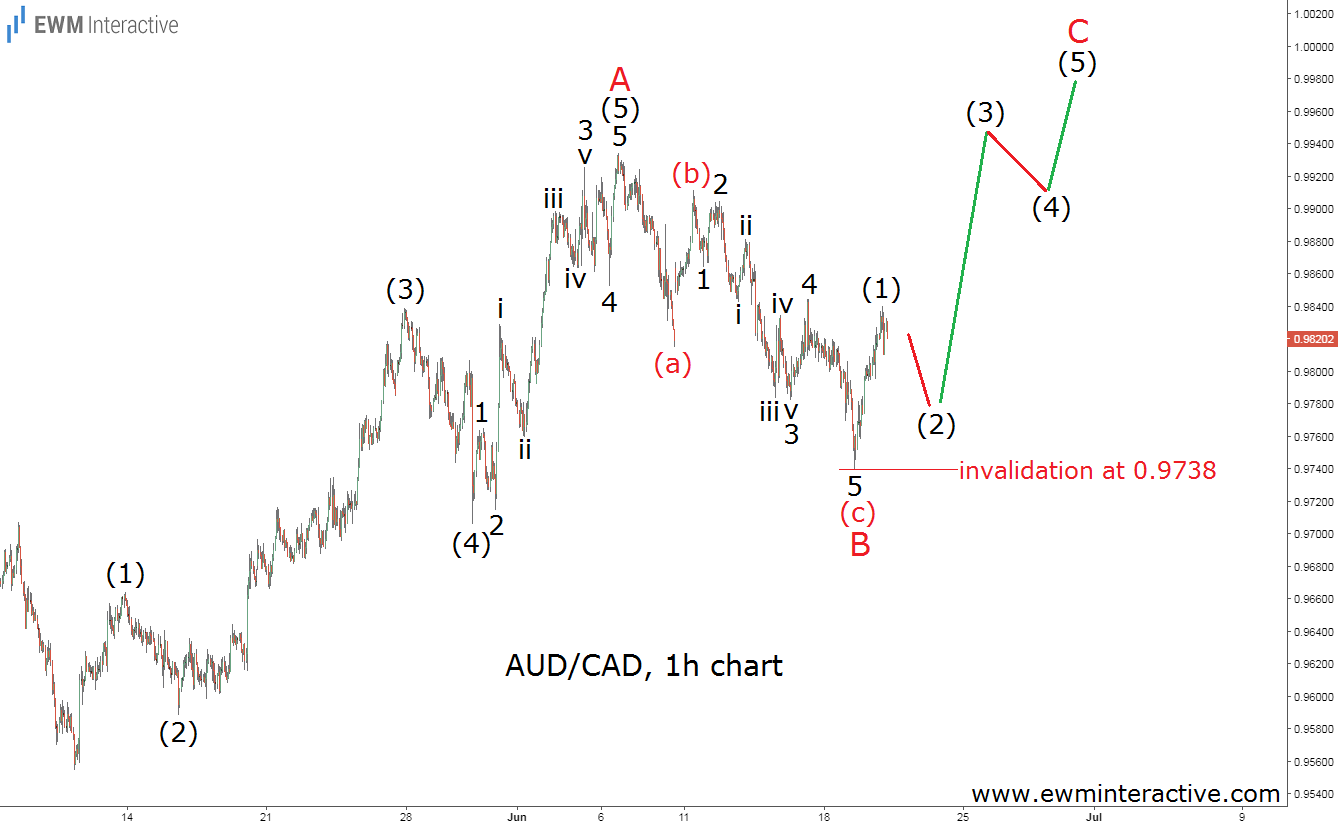
Yesterday, we wrote about a pattern spotted on the chart of the Australian dollar against the New Zealand counterpart. Today, the Aussie is once again in focus, but this time against another one of its major rivals – the Canadian dollar. AUD/CAD fell from 0.9935 to 0.9739 in just ten trading days this month. But instead of dragging the pair even lower, the bears suddenly ran out of steam and allowed the bulls to lift the rate to 0.9840 earlier today. In order to find out what do the current recovery and the preceding weakness mean for AUD/CAD’s near future, we need to put them into Elliott Wave context. The results provided by the hourly chart below are more than satisfactory.
AUD/CAD’s 60-minute chart shows that the recent decline is actually a natural zigzag correction, labeled (a)-(b)-(c), which precedes a textbook five-wave impulse to the upside from 0.9555 to 0.9935 that developed between May 10th and June 6th. It is interesting to notice that two lower degrees of the impulsive structure can be recognized within waves (5) of A and (c) of B.
According to the theory, the trend can now be expected to resume in the direction of the five-wave rally, which means wave C has a good chance of lifting AUDCAD to parity. Besides, since there is already a bullish reversal in place, 0.9738 can be used as a stop-loss level. If this count is correct, as long as this figure stays intact there is still hope for the bulls to reach the 1.0000 mark.
