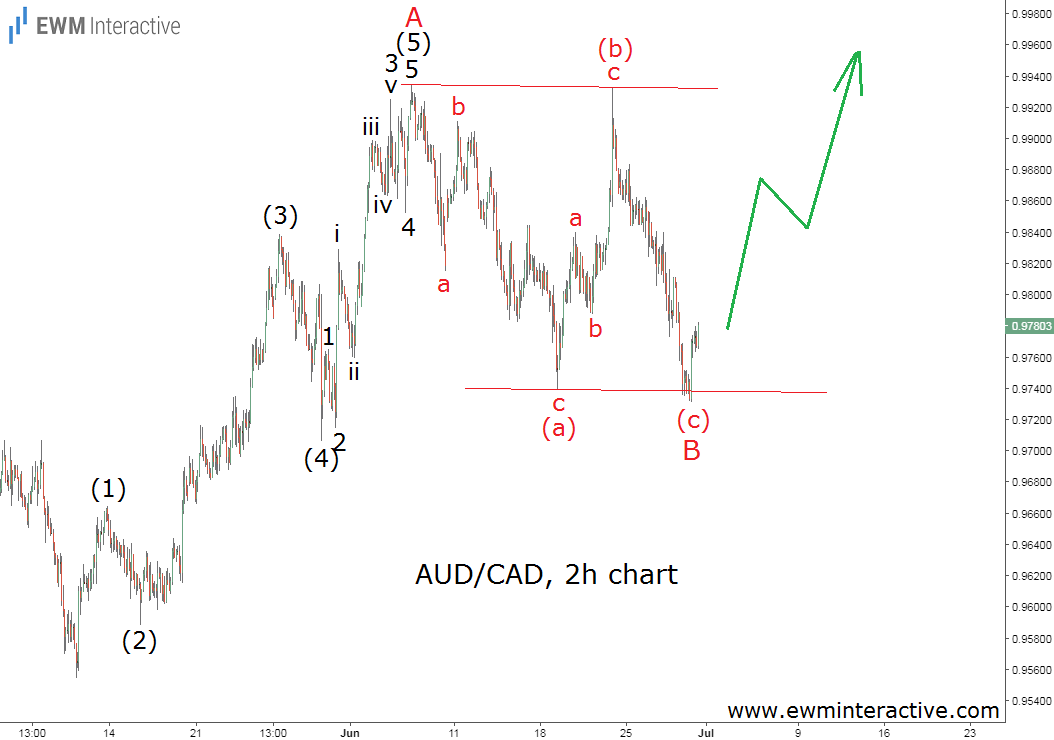
Nine days ago, while AUD/CAD was trading at 0.9820 on June 20, we found a textbook 5-3 Elliott Wave pattern on its hourly chart, which suggested the bulls were going to lift the pair to parity in the next couple of weeks. And indeed, a rally occurred shortly after, but the resistance near 0.9930 did not allow it to continue and caused another decline instead. As of this writing, AUD/CAD is hovering around 0.9750. Let’s see how the situation has changed in the last seven trading days.
The rally from 0.9555 to 0.9935 still looks like a solid five-wave impulse, meaning the rest of the pair’s development is nothing more than a natural three-wave correction. In our previous update we thought the decline to 0.9738, labeled here as wave (a), marked the end of the corrective phase of the cycle. The market did not think so. AUD/CAD climbed to 0.9932 on June 22nd, but this recovery was limited to only three waves, which meant the exchange rate was still in pullback mode. The following selloff to 0.9731 fits in the position of wave (c) of a regular flat correction wave B.
In addition, wave B has been developing between the parallel lines of a channel, whose lower line caused a nice bounce today confirming its validity as a support. If this count is correct, the bulls are ready to make another attempt to reach parity. Even if the bears somehow manage to drag AUD/CAD a little lower, as long as the pair holds above 0.9555, the 1.000 mark remains a viable target.
