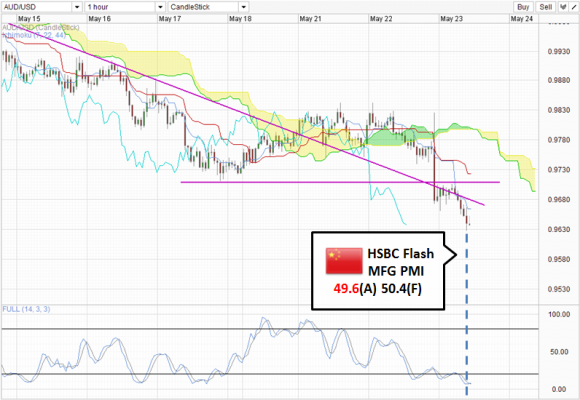
The Chinese HSBC Flash Manufacturing PMI fell below the 50.0 par for the first time since October 2012, indicating that the manufacturing sector is shrinking. Flash data came in at 49.6, much lower than the 50.4 estimate and 50.4 previous. This is in line with the fall in GDP, and suggest that China’s economy is indeed slowing down, and is unlikely to reverse in the near term with the People’s Bank of China stating that the decline is expected and in fact desirable for structural changes. This rules out any possibility of stimulus from the Central Bank, and the question that we should ask is not whether the economy will rebound, but how much lower can we go?
All these should scare AUD/USD bulls. Australia’s economy and by relation its currency is highly correlated to Chinese’s economy, especially with the manufacturing and construction sector as they are a key source of demand for Australia’s mining sector. It remains to be seen whether the recent rate cut by RBA which was meant to invigorate the falling mining sector and slower than expected employment growth will have leftover room to counter the decline in China. Reading from recent RBA minutes, it seems that the assertion from RBA is that China is “stable”. If we can take RBA’s words on face value, then it would mean that RBA has not priced in a scenario for China slowdown, and that would actually mean that further rate cuts may be necessary to curb the negative effect arising from this.
Hourly Chart
Market agrees with the notion above, with price pushing for new weekly and 2013 lows after the news was released. From a technical perspective, the bearish news did not really change the overall big picture, but merely accelerated the bearish cause which has seen AUD/USD breaking below Monday levels, breaking last week’s low with the subsequent recovery being rejected by the same Friday low and the descending trendline that has been in play last week. With the breaking of 0.97, the corrective recovery that has been in play since the start of this week has been invalidated, and the ability for bears to trade below the descending trendline is a good sign that bearish continuation is back.
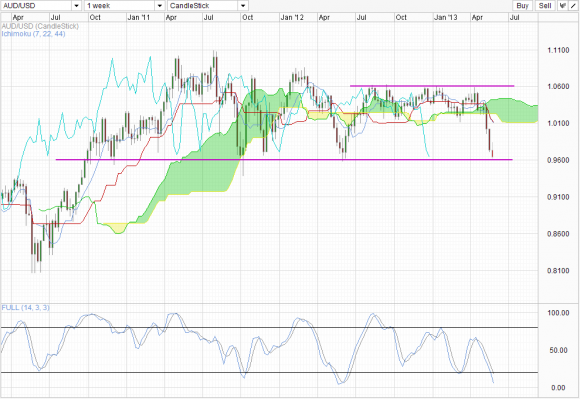
Weekly Chart
From the Weekly Chart, we are seeing the potential 3 black crows formation after the bearish breakout of the Kumo. 0.96 may provide significant support, but that may not be enough if the 3rd Crow is properly formed (e.g. with the same body length closer to the prior 2 crows), which will bring us below 0.96 and close to 0.94, which is the final vestige of bullish hope against a move back below 0.90. However, bulls may still get some reprieve if Stochastic indicator proves to be accurate. Stoch readings are currently deep within the Oversold region, around the same levels of the previous trough back in May/June 2012, where price found support around 0.96. If history repeats itself, we could see potential bullish reversal back towards 1.06 once more, which is in line with the long-term sideways trend that has been in play since Oct 2011.
- English (UK)
- English (India)
- English (Canada)
- English (Australia)
- English (South Africa)
- English (Philippines)
- English (Nigeria)
- Deutsch
- Español (España)
- Español (México)
- Français
- Italiano
- Nederlands
- Português (Portugal)
- Polski
- Português (Brasil)
- Русский
- Türkçe
- العربية
- Ελληνικά
- Svenska
- Suomi
- עברית
- 日本語
- 한국어
- 简体中文
- 繁體中文
- Bahasa Indonesia
- Bahasa Melayu
- ไทย
- Tiếng Việt
- हिंदी
AUD/USD: Lower On Chinese Manufacturing Decline
Published 05/23/2013, 02:04 AM
Updated 07/09/2023, 06:31 AM
AUD/USD: Lower On Chinese Manufacturing Decline
Latest comments
Loading next article…
Install Our App
Risk Disclosure: Trading in financial instruments and/or cryptocurrencies involves high risks including the risk of losing some, or all, of your investment amount, and may not be suitable for all investors. Prices of cryptocurrencies are extremely volatile and may be affected by external factors such as financial, regulatory or political events. Trading on margin increases the financial risks.
Before deciding to trade in financial instrument or cryptocurrencies you should be fully informed of the risks and costs associated with trading the financial markets, carefully consider your investment objectives, level of experience, and risk appetite, and seek professional advice where needed.
Fusion Media would like to remind you that the data contained in this website is not necessarily real-time nor accurate. The data and prices on the website are not necessarily provided by any market or exchange, but may be provided by market makers, and so prices may not be accurate and may differ from the actual price at any given market, meaning prices are indicative and not appropriate for trading purposes. Fusion Media and any provider of the data contained in this website will not accept liability for any loss or damage as a result of your trading, or your reliance on the information contained within this website.
It is prohibited to use, store, reproduce, display, modify, transmit or distribute the data contained in this website without the explicit prior written permission of Fusion Media and/or the data provider. All intellectual property rights are reserved by the providers and/or the exchange providing the data contained in this website.
Fusion Media may be compensated by the advertisers that appear on the website, based on your interaction with the advertisements or advertisers.
© 2007-2024 - Fusion Media Limited. All Rights Reserved.