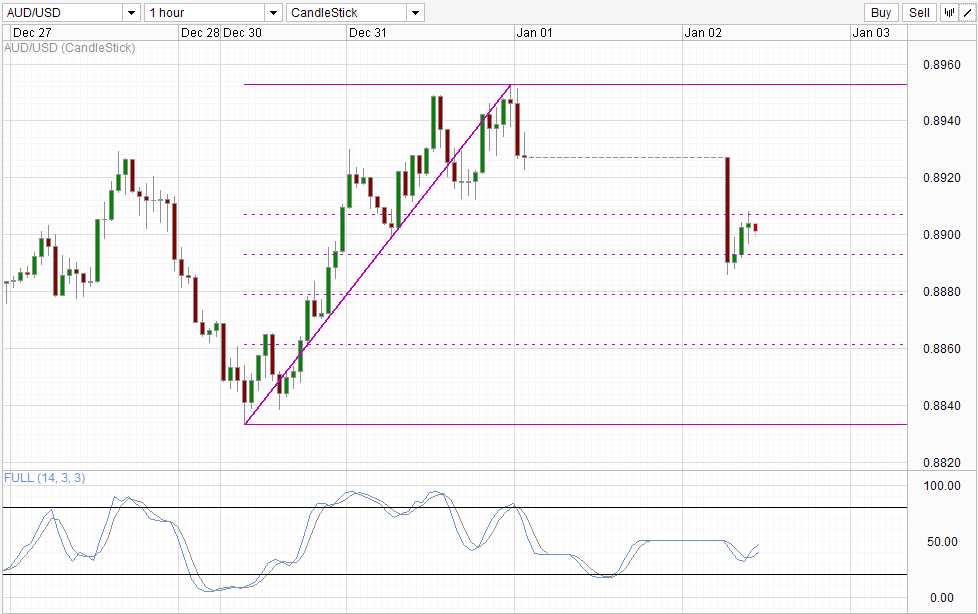
No surprises for the AUD/USD in this new year as bears continue to remain firmly in charge. Prices fell to a low of 0.8886 on open, led by the disappointing Chinese PMI Manufacturing number that was released on New Year's Day. The weaker than expected growth rate seen in China's manufacturing sector pile added futher woes to Australia, which is already suffering from a plateauing mining sector which has contributed to the decline in Australia's slower GDP growth, thus dding bearish pressure to AUD.
Hourly Chart AUD/USD Hourly Chart" title="AUD/USD Hourly Chart" width="452" height="615">
But, it seems that bulls are not taking this without a fight, which makes sense considering that price has been on the uptrend since the start of this week. Today's decline found support around the 50% Fib retracement level, with current price testing the 38.2% Fib and confluence with support support seen on 27th Dec and the swing low of New Year's Eve. Should price manage to break the aforementioned level, we could see bullish acceleration towards the recent swing high and the potential for bullish extension beyond that remains. Stochastic indicator agrees with Stoch curve currently staying around the 50.0 "resistance" level. If price head higher from here stoch curve will break the aforementioned "resistance" and suggest that bullish
From a fundamental perspective, there is a chance that AUD traders have overreacted to the Chinese PMI numbers. Case in point, Australia's stock index opened bullishly today, with none other than mining companies stocks leading the bullish charge. This suggest that China's recent PMI numbers isn't that bad after all. In retrospect, a 51.0 print is still respectable even though it is lower than the 51.3 expected and 51.4 previous. Market has been sprouting doom and gloom prophesies about China, but incredibly the Asian giant remains robust despite all the financial reforms and the recent credit/liquidity scare. Hence, it may not be surprising that market is actually bullish that China has defied the odds and manage to grow mildly.
This is in no way saying that the AUD/USD should be pushing higher in the long run, but rather bears may have overextend themselves amidst a short-term bullish uptrend, and we could be seeing strong bullish correction in the short-term coming up.
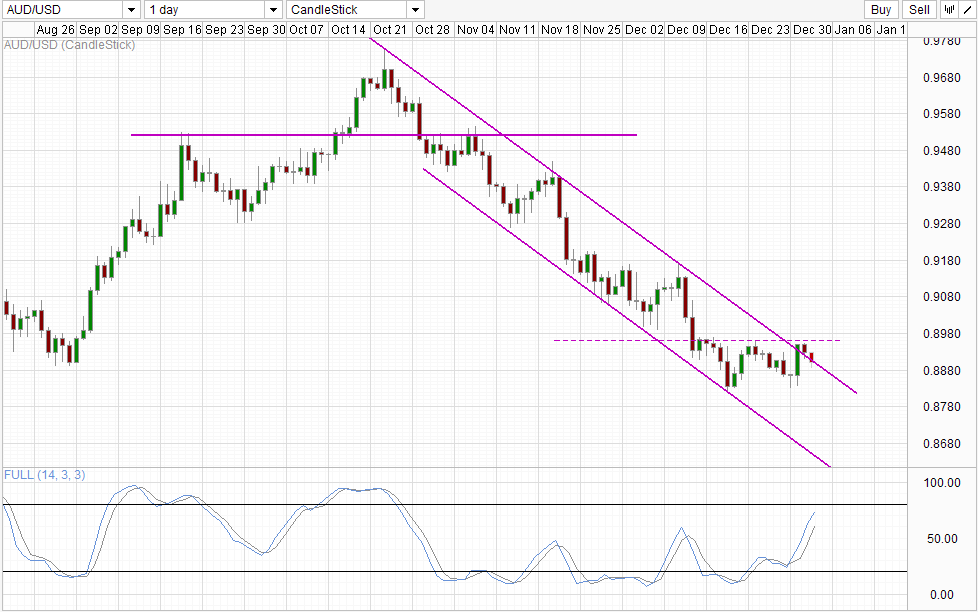
Daily Chart AUD/USD Daily Chart" title="AUD/USD Daily Chart" width="452" height="615">
The long-term trend for the AUD/USD remains lower, with the bearish channel remains in play despite prices breaking out of Channel Top 2 days ago. 0.896 continues to act as a formidable ceiling, sending price lower back towards Channel Top currently. Nonetheless, looking at Stochastic curve which is pointing higher, a rebound off Channel Top towards 0.896 once again cannot be ruled out, echoing the bullish potential in the short-term. However, divergence between Stoch peaks and price peaks suggest that we could be seeing a strong long-term bearish push coming up, which will likely break the 0.882 - 0.896 consolidation that has been in play in the past 2 weeks.
The only long-term bullish potential for the AUD/USD would be a surprise weakening of the USD which may come in Feb - Mar when the US debt ceiling issue comes back into focus. However, even that could turn out to be bears' fortune should Congress manage to negotiate a deal without much fuss.
Original post
- English (UK)
- English (India)
- English (Canada)
- English (Australia)
- English (South Africa)
- English (Philippines)
- English (Nigeria)
- Deutsch
- Español (España)
- Español (México)
- Français
- Italiano
- Nederlands
- Português (Portugal)
- Polski
- Português (Brasil)
- Русский
- Türkçe
- العربية
- Ελληνικά
- Svenska
- Suomi
- עברית
- 日本語
- 한국어
- 简体中文
- 繁體中文
- Bahasa Indonesia
- Bahasa Melayu
- ไทย
- Tiếng Việt
- हिंदी
AUD/USD: Bears Remain Firmly In Charge
ByMarketPulse
AuthorMingze Wu
Published 01/02/2014, 12:28 AM
Updated 03/05/2019, 07:15 AM
AUD/USD: Bears Remain Firmly In Charge
Latest comments
Loading next article…
Install Our App
Risk Disclosure: Trading in financial instruments and/or cryptocurrencies involves high risks including the risk of losing some, or all, of your investment amount, and may not be suitable for all investors. Prices of cryptocurrencies are extremely volatile and may be affected by external factors such as financial, regulatory or political events. Trading on margin increases the financial risks.
Before deciding to trade in financial instrument or cryptocurrencies you should be fully informed of the risks and costs associated with trading the financial markets, carefully consider your investment objectives, level of experience, and risk appetite, and seek professional advice where needed.
Fusion Media would like to remind you that the data contained in this website is not necessarily real-time nor accurate. The data and prices on the website are not necessarily provided by any market or exchange, but may be provided by market makers, and so prices may not be accurate and may differ from the actual price at any given market, meaning prices are indicative and not appropriate for trading purposes. Fusion Media and any provider of the data contained in this website will not accept liability for any loss or damage as a result of your trading, or your reliance on the information contained within this website.
It is prohibited to use, store, reproduce, display, modify, transmit or distribute the data contained in this website without the explicit prior written permission of Fusion Media and/or the data provider. All intellectual property rights are reserved by the providers and/or the exchange providing the data contained in this website.
Fusion Media may be compensated by the advertisers that appear on the website, based on your interaction with the advertisements or advertisers.
© 2007-2025 - Fusion Media Limited. All Rights Reserved.
