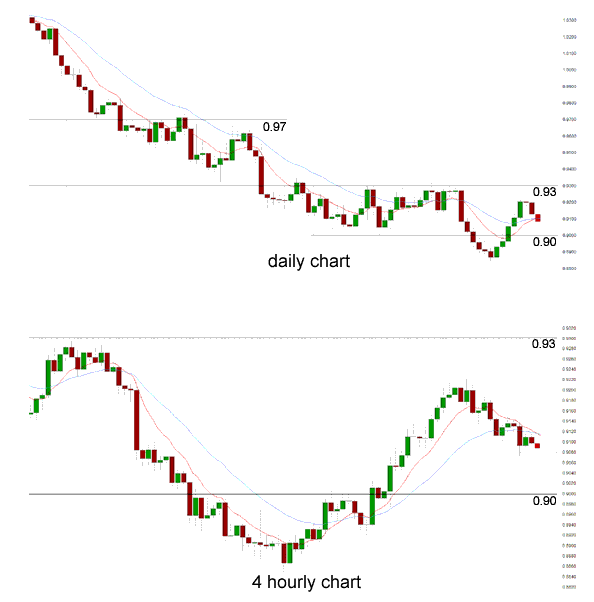
The AUD/USD has reversed strongly in the last couple of days moving back towards and below 0.91, after having spent the last week moving very well from three year lows to move back above the key level of 90 cents and beyond to a two week high just above 0.92 to finish out last week. In the week prior, it fell very strongly and appeared to resume the medium term down trend as it moved to a new three year low near 0.8850 but it reversed very well and looked poised to continue back towards the longer term resistance level at 0.93 before its recent reversal. It was only a few weeks ago the AUD/USD moved up towards the 0.93 level again as it continued to place buying pressure on that level. It was during this time it did very well to maintain its price level well above 0.92 as place upward buying pressure on the resistance level at 0.93 however a few weeks ago, it fell sharply to back under 0.92 and started to place pressure on the short term support level of 0.9150.
Over the course of the last month or so the 0.93 level has provided reasonable resistance to any movement higher and this level will likely play a role again should the AUD/USD continues its rally up above 0.92. Throughout July, the AUD/USD spent most of its time trading between 0.90 and 0.93 threatening to break through either level at multiple stages. The 0.9150 level also became a key level during that time providing both some resistance and more recently support, and this was called upon again a few weeks ago providing some much needed support however it was completely ignored a couple of weeks ago as the AUD/USD fell heavily through it. It was only a month or so ago that many were waiting for the AUD/USD to break below the 90 cents level and then it would have been a matter of how far can it drop. It had continued to drift lower and move towards the 90 cents level, a level not seen for three years. Considering the speed of its decline over the last few months, the last month or so had seen a significant slowing down and almost some consolidation as it has rested well on the support at 0.90 and made its way back to 0.93 on a few occasions.
The last few months have seen the AUD/USD establish a strong medium term down trend with lower peaks and lower troughs, as it has moved from near 1.06 down to near 0.90 in that time. In doing so, it has completely ignored any likely support at previous key levels at 1.04, 1.0360 and 1, and more recently the long term support level at 0.97. Up until mid April, the Australian dollar was enjoying its best move higher since October and November last year. After making a solid run higher in the middle of June back towards the key level of 0.97, the AUD/USD has since continued its strong and steady decline moving to below 0.90 and levels not seen since near the middle of 2010. This has seen it experience a significant strong trend that would have caught many people on the wrong side of.
Australia’s dollar is the biggest loser among major currencies this year, tumbling 9.9 percent against a basket of nine peers including the euro, yen and pound, according to Bloomberg Correlation Weighted Indexes. It’s headed for its biggest annual decline based on those indexes since it tumbled 11 percent in 1990. Pacific Investment Management Co. and BlackRock Inc., which manage almost $6 trillion combined, say the Aussie is either overvalued or due for further losses as the country adjusts to the end of a mining-investment boom and a slowdown in China, which buys a third of its merchandise exports. The currency’s record 10-month run above $1 ended in May after the Reserve Bank of Australia cut its main interest rate by a quarter-percentage point to 2.75 percent to stoke growth. 
AUD/USD August 14 at 00:45 GMT 0.9086 H: 0.9149 L: 0.9073
During the early hours of the Asian trading session on Wednesday, the AUD/USD is continuing to ease back under 0.91 after trading around the level for the last 12 hours or so. Despite its slowing and slight recovery the last few weeks, the Australian dollar has been in the middle of a free-fall, as the currency has lost around 15 cents since the beginning of May. In moving through to 1.0580 only a few months ago, it moved to its highest level since January. Current range: trading just below 0.9090.
Further levels in both directions:
• Below: 0.8850
• Above: 0.9200 and 0.9300
(Shows the ratio of long vs. short positions held for the AUD/USD among all OANDA clients. The left percentage (blue) shows long positions; the right percentage (orange) shows short positions.)
The long position ratio for the AUD/USD has moved back towards 60% as the Australian dollar has eased back under 0.91. The trader sentiment remains in favour of long positions.
Economic Releases
- 00:30 AU Westpac Consumer Confidence (Aug)
- 01:30 AU Wage Price Index (WPI) (Q2)
- 08:30 UK BoE MPC minutes
- 08:30 UK Average Earnings (incl. bonus) (Jun)
- 08:30 UK BoE MPC minutes (August meeting)
- 08:30 UK Claimant Count Change (Jul)
- 08:30 UK Claimant Count Rate (Jul)
- 08:30 UK ILO Unemployment Rate (Jun)
- 09:00 EU GDP (1st Est.) (Q2)
- 12:30 US PPI (Jul)