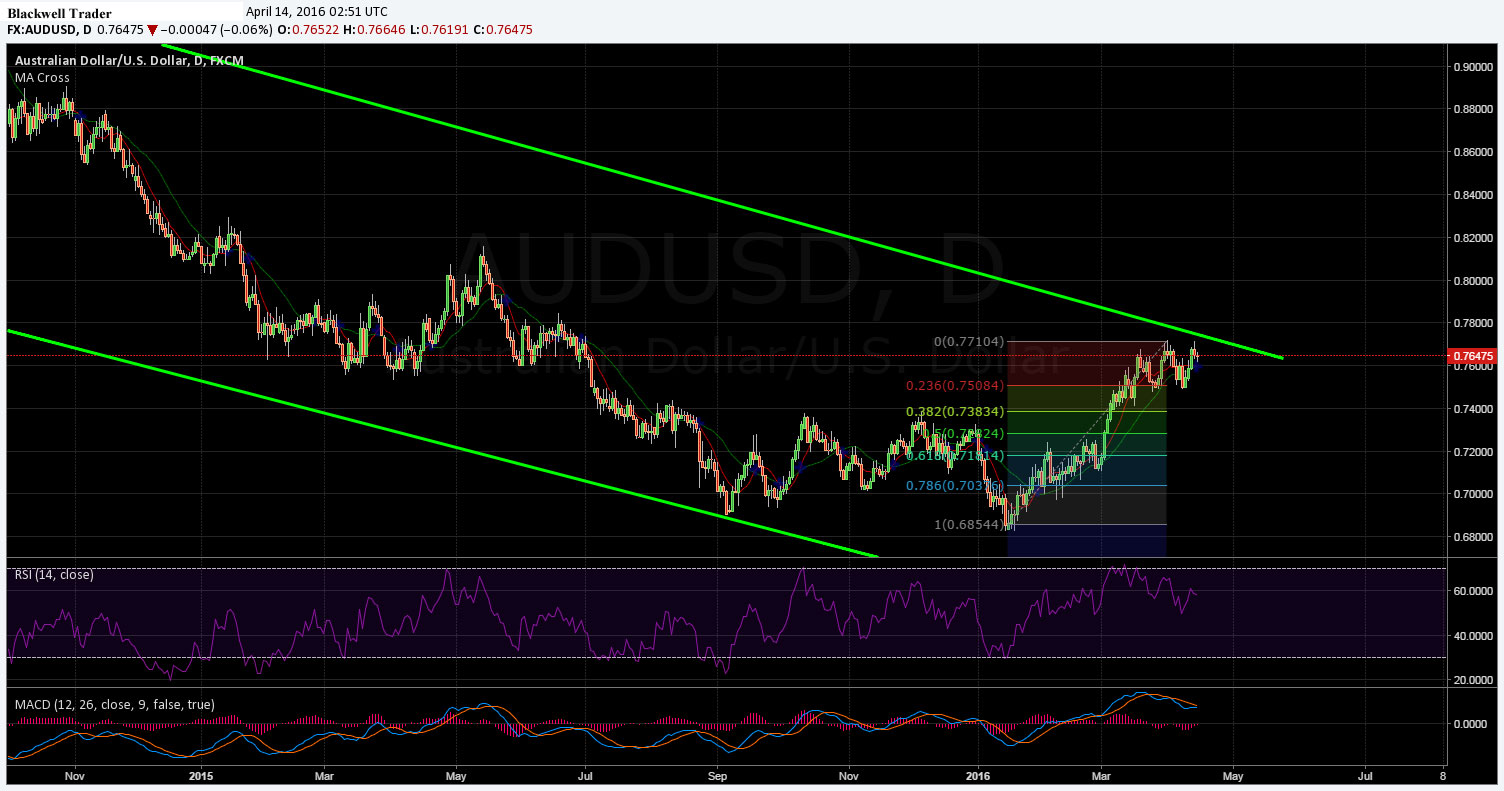
The last few days have been relatively lack lustre for the Australian dollar as the pair has largely entered a sideways consolidation pattern. In fact, even a stronger than expected labour market result, which saw Australian unemployment decline from 5.8% to 5.7%, failed to buoy the pair. The question therefore remains as to what's next for the venerable pair given the lack of a strong trend direction.
Taking a look at both the daily and weekly charts provides for some illuminating study of the long run bearish trend line. It is clear that price action has been largely on a retracement since the middle of January, however, the weekly bearish trend line is looming, which could see the pair recommence an impulse wave lower.
In addition, the RSI oscillator has actually started to trend lower after just touching upon the oversold level, which could imply some bearish activity ahead for the pair. The Stochastic Oscillator has also reached into reversal territory with some divergence also evident within the indicator.
Further to the above, price action has largely entered into a corrective phase which mirrors the action prior to the sharp downtrend commencement from August, 2014. Subsequently, there is plenty of historical scope to suggest that a bearish impulse wave pattern is about to recommence. However, price action will need to surmount the 23.6% Fibonacci level, at 0.7509, to confirm a move lower.

Ultimately, it is going to be interesting to see which way the Australian dollar moves now that the long run bearish trend line is in play. However, given the anecdotal historical evidence, coupled with the current oscillator divergence, it is clear that the downside is the probable choice in the medium term. Subsequently, I firmly expect the AUD to make another run at pushing through the trend line, before failing and recommencing a bearish wave in the coming week.
