Stock market today: Nasdaq closes above 23,000 for first time as tech rebounds
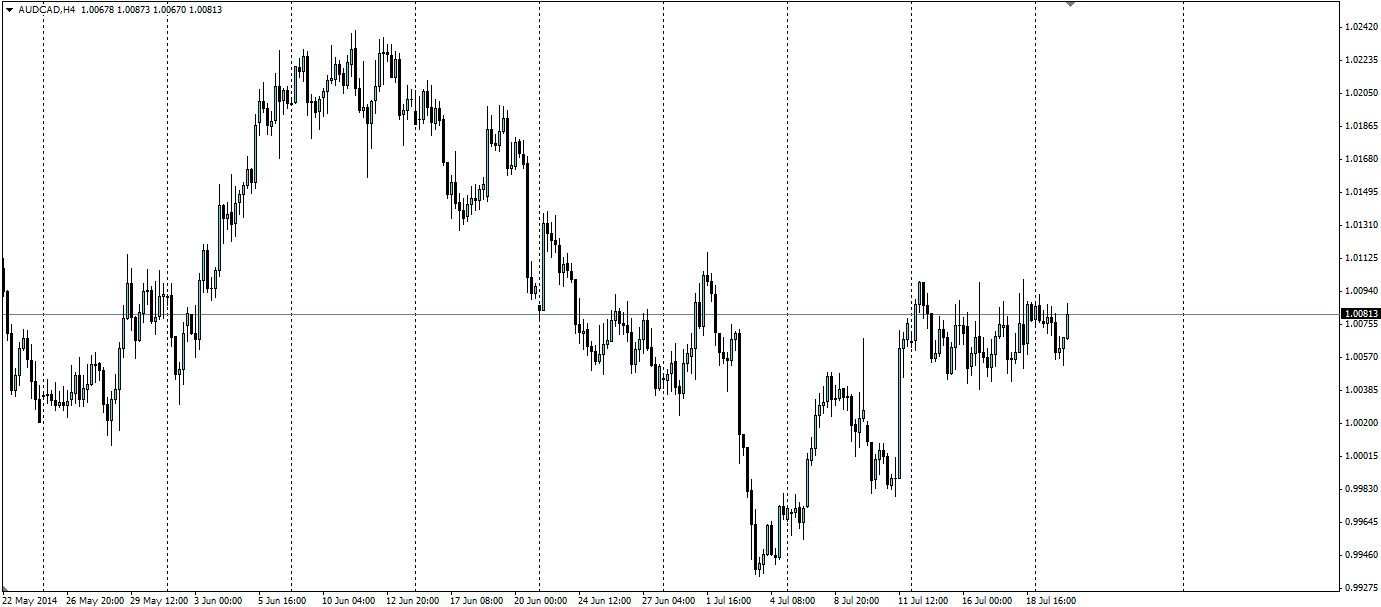
The AUD/CAD pair has some interesting features on the H4 chart that could point to a breakout and a movement higher in favour of the Aussie.

June was a month that definitely favoured the Canadian Dollar. The Aussie depreciated from a high of 1.024 on 6th June to a low of 0.9935 on the 3rd July. June saw Canadian CPI reported at 2.3% year on year, which fuelled speculation that the Bank of Canada will raise interest rates sooner than expected to combat this.
Early in July BoC Governor Stephen Poloz said this is unlikely to happen as the economy is not strong enough and they see the risk of inflation as balanced. He also said “they see the Canadian economy returning to full capacity” in Mid-2016 and interest rates are not likely to rise until then, leading to a pullback. The Ivey PMI, a report of the whole Canadian economy, gives more cause for concern with the latest reading at 46.9, down from 48.2. The Unemployment rate has not helped, unexpectedly rising to 7.1%. This week only Retail Sales figures are released for the CAD, and these should be watched as they could add to volatility.
Australia on the other hand suffered when the trade balance shocked the market at -$1.91b from -$0.12b in early July and the RBA is refusing to speak about raising interest rates any time soon. It has, however, benefited from Chinese data that is coming back towards the positive side and this is expected to continue this week with the HSBC Chinese Manufacturing PMI. If it remains above 50.0, the AUD will benefit due to Australia’s reliance on China for trade. Also keep an eye on Australian CPI later this week.

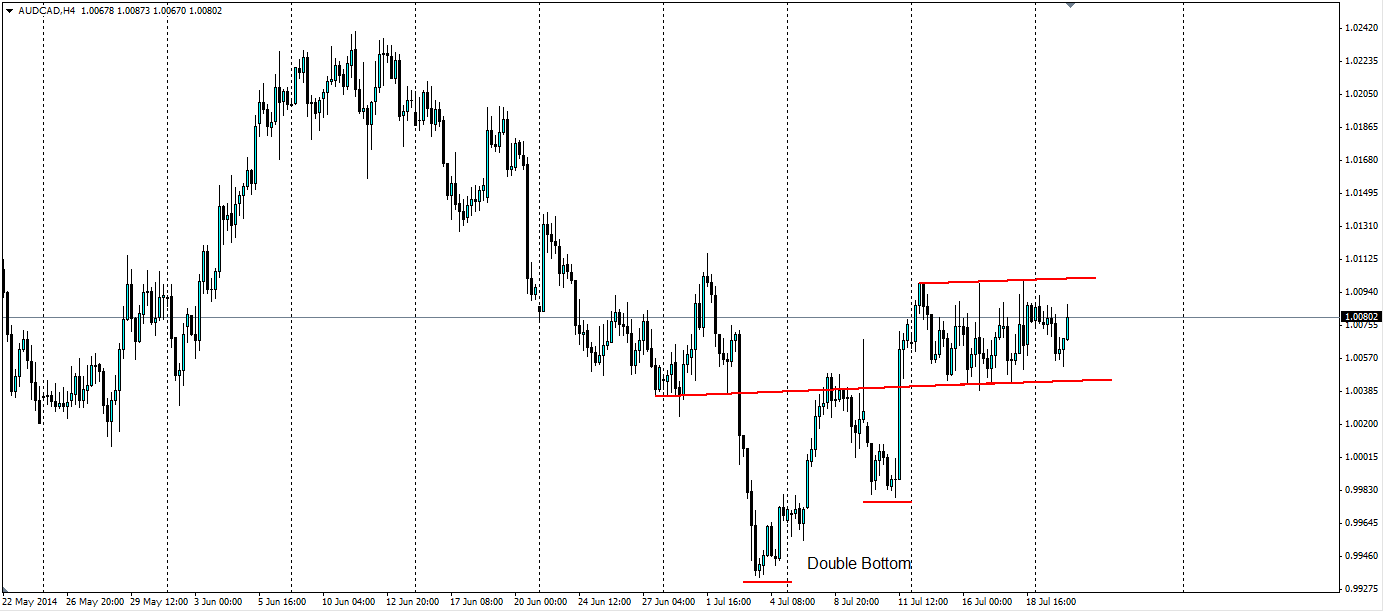
The pull back from the low in early July resulted in the formation of a double bottom, a bullish reversal signal. This led into the tight ranging pattern that we currently find ourselves in and a breakout to the upside is the likely result. Technically speaking, the double bottom confirms the reversal of the bearish trend and the beginning of a bullish one, the ranging pattern is merely a pause in the movement. The fundamentals are there to back up a movement higher for the Aussie, however the Chinese data this week will need to agree.
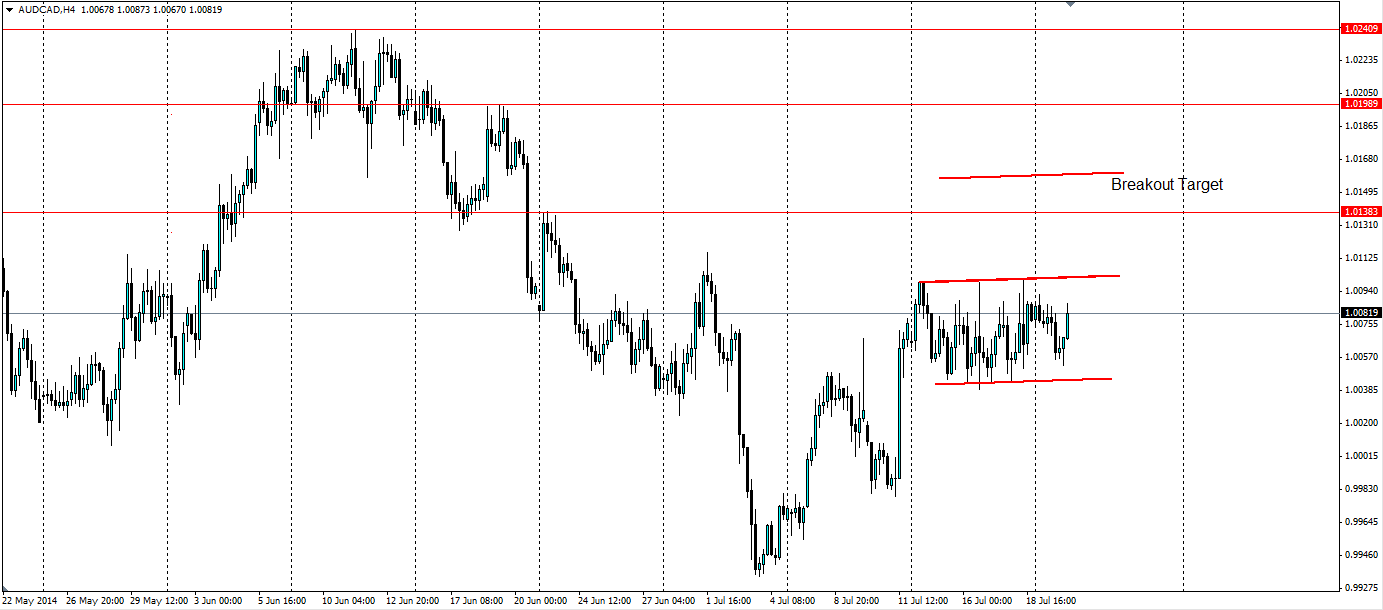
Look for the confirmation of a breakout once the resistance at 1.0101 has broken. A target for the breakout will be the width of the current ranging pattern, i.e. 56 pips or at 1.0157. Previous levels of support will act as resistance, such as 1.1038, 1.0199 and 1.0241.

A double bottom pattern on the AUD/CAD H4 chart points to a reversal of the down trend and a breakout to the upside of the current ranging pattern is likely, but will depend on economic news this week.
Which stocks should you consider in your very next trade?
The best opportunities often hide in plain sight—buried among thousands of stocks you'd never have time to research individually.
That's why smart investors use our Stock Screener with 50+ predefined screens and 160+ customizable filters to surface hidden gems instantly.
For example, the Piotroski's Picks method averages 23% annual returns by focusing on financial strength, and you can get it as a standalone screen. Momentum Masters catches stocks gaining serious traction, while Blue-Chip Bargains finds undervalued giants.
With screens for dividends, growth, value, and more, you'll discover opportunities others miss. Our current favorite screen is Under $10/share, which is great for discovering stocks trading under $10 with recent price momentum showing some very impressive returns!
